
Notification and Record Journals
Overview
The Notification and Record Journals view is designed to show records about alarms registered in the system, logging notifications, and recording events. You can use this view to track active alarms to handle them promptly, analyze past states and events, view the notification history.
You can find the description of the notification system and its configuration details in the Working With System ➝ Notification System chapter.
The journal tabs have similar structure. They show information as tables that update dynamically.
You can adjust the display of information and mute sound notifications using View Settings for all views.
You can sort the information in the table using filters in the upper part of the screen. They may vary for different tabs. For example, the E-Mail tab allows filtering only by the event period and profile, while the SNMP tab lets you filter by the period, stream, probe, severity level, profile, and group of events.
As data accumulates in the journal, the results are paginated. To move between records, use a navigation bar in the upper and lower part of the journal.
You can stop the data update on the page by clicking the Pause button above the table to the right. To delete all records, click Clear Journal.
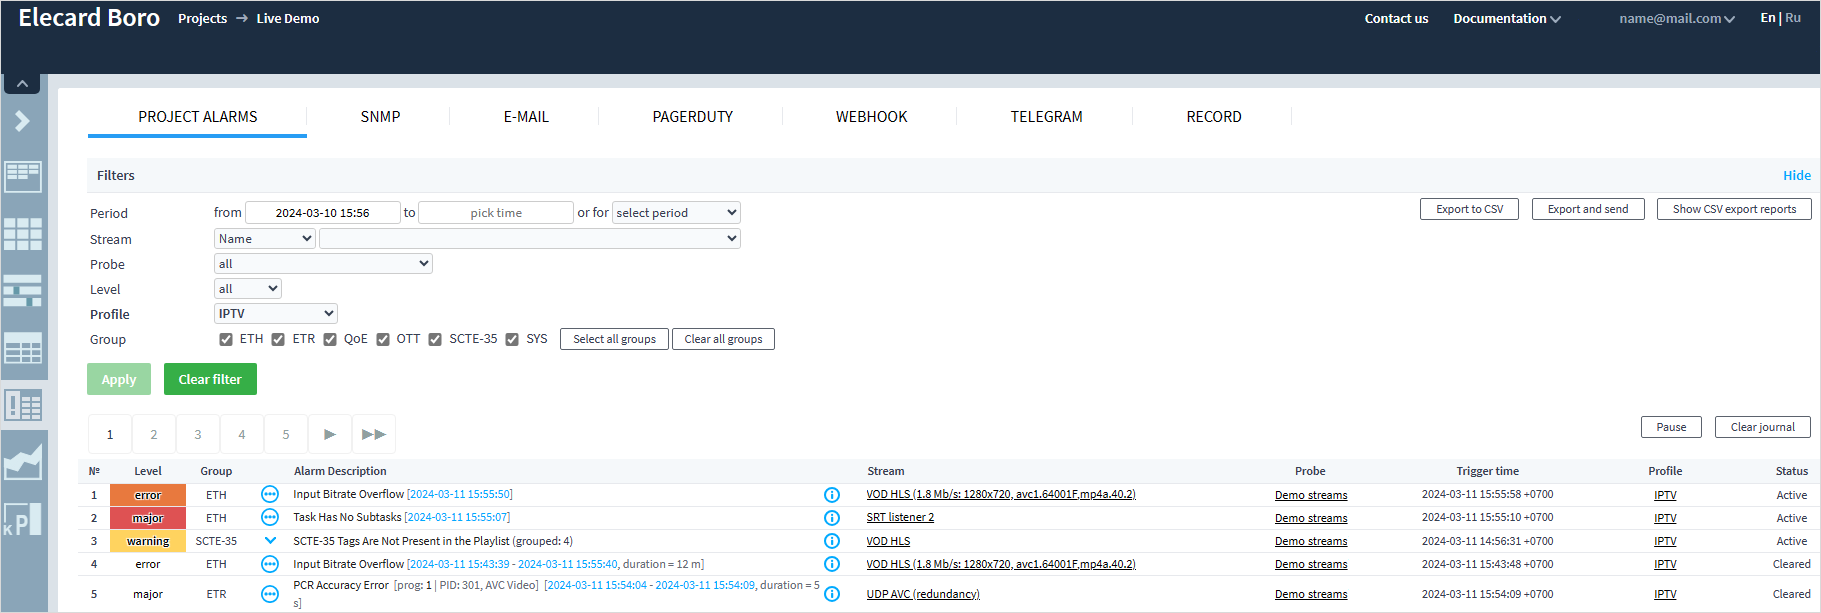
Project Alarms Tab
The Project Alarms tab displays all alarms registered in the system. They are displayed as a table where new events dynamically replace previous records, thus making it scrollable.
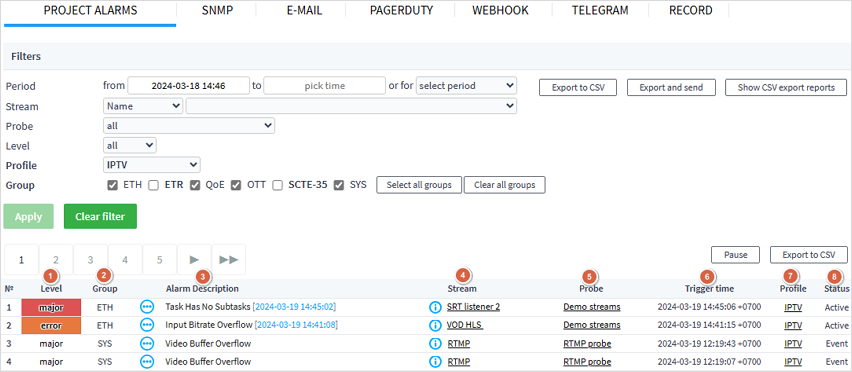
The table comprises 8 columns with the following information:
Severity level
Event group
Alarm description
Stream name
Probe name
Trigger time
Profile
Status
You can export a report about registered alarms in the CSV format and save it to your computer or e-mail it to any project member for further detailed review. To export a new report, click Export to CSV. You will see a window with a table that displays the history of all reports. The reports in the table are sorted in descending order by the creation date:
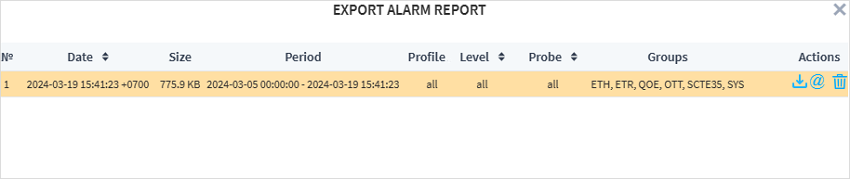
For each report, the list provides a creation date, size, event monitoring period, profile, severity level, probe name, and groups of monitored events. Each line ends with interactive elements that you can use to download the report, e-mail it, or delete it.
To export data and e-mail it straight away, click Export and Send. You will see a window with a list of e-mail addresses that you can select by ticking corresponding checkboxes. If there is no address you need, scroll down to the end of the list and enter the required address in the last line. Click Send.
If you want to view the list of exported reports without creating a new report, click Show CSV Export Reports. If necessary, you can download any report created earlier.
Severity Level
The Level ➀ column displays the severity levels of cleared and active alarms. For active ones, the severity is additionally marked with a color. Cleared alarms are registered with the severity level, but without coloring. The user can adjust severity levels when configuring triggers in the notification profile.
Event Group
The Group ➁ column designates a group to which an alarm event belongs:
ETH— Ethernet warningsETR— errors described in the ETSI TR 101-290 standardQoE— quality of experience errorsOTT— over-the-top media service errorsSCTE-35— SCTE-35 cue tone errorsSYS— system errors
Alarm Description
The Alarm Description ➂ column indicates the alarm type and the time when it started. In case of cleared alarms, it also shows time when a certain alarm was cleared and its total duration.
To the left of alarms, there are interactive elements:
Icon
 indicates that several alarms of one type in one stream are grouped in one record. Grouping is only used for active alarms. To expand the list of grouped alarms, click on the arrow.
Icon
 opens alarm details. Use this action, to open a window with details about any alarm:
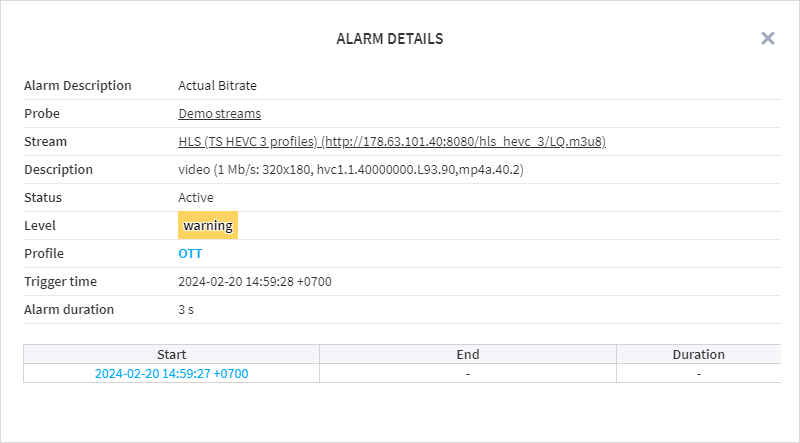
The window provides an alarm description, the name of a probe that registered the alarm, the name of a stream in which this happened, alarm status and severity level, alarm profile, trigger time, and duration. The information in the window may differ depending on the chosen profile. For example, if the OTT profile is selected, the window will additionally display the description of the monitored stream.
Pay attention that most of the dates in the journal and in the window with details are hyperlinks (highlighted in blue). If you click on the date, you will be redirected to the page of the corresponding task with all the graphs and journals positioned based on the event date.
Stream Name
The Stream ➃ column shows stream names or their URIs if names are not assigned. If you click a name, a page with information about a specific stream will open.
There is an icon  to the left of each stream’s name that opens a window with detailed information about a particular stream/service.
This window can contain task description, a PSI table for a stream, an OTT manifest and other service information.
Additional Information
The Probe ➄ column shows the name of a probe that tracks a certain stream. To open the probe’s page, left-click its name.
The Trigger Time ➅ column indicates the time when a certain event was registered. You can find more information in the description of the Notification system.
The Profile ➆ column displays the name of an alarm profile assigned to the analysis task. To view the profile, left-click it.
The Status ➇ column indicates the alarm state.
Persistent alarms are indicated by the Active status, while those alarms that have been recovered are indicated by the Cleared status.
Other Tabs
SNMP
The SNMP tab contains a table with records about sent SNMP notifications. As compared to the table in the previous tab, it has three distinct columns:
Dst IP — contains the IP addresses of SNMP traps.
Send Time — shows time when notifications were sent.
Message Type — indicates the type of message, e.g.
Event.
E-Mail
The E-Mail tab holds a journal of sent e-mail notification about events. The journal comprises the following columns:
Send Time — displays the time when e-mails were sent.
Probes — shows probe names. To view probe details, click on its name.
Details — contains the icons of circles with dots. If you click an icon, a window with event details will open. In this window, you can find the e-mail of the notification recipient, the event description, the name of the probe that registered this event, the task name, the registration time.
Profile — contains the names of alarm profiles.
Levels — displays event severity levels in the form of colored squares. If multiple events are registered simultaneously, the column may contain several squares indicating the levels of severity with their colors.
PagerDuty
The PagerDuty tab displays notifications sent to the PagerDuty system. This tab is similar to the SNMP tab in terms of structure, except that it has no Dst IP column. In case an attempt to send a notification is unsuccessful, repeated attempts will be made. See the details in the description of the Webhook notification journal.
Webhook
The Webhook tab contains a list of HTTP notifications in real time. The tab is similar to PagerDuty in terms of displayed information.
To the left of the Alarm Description column, there are detailed information icons. If you click such an icon, you will see a window with information about an alarm in the form of a POST request in the JSON format and a response to this request. If the HTTP response code is more or equals 400, the icon becomes red, and the response will contain error details. Moreover, the system will attempt resending after 1, 5 and 30 minutes, in case of the following:
The HTTP code is more or equals 500.
Any error occurs when trying to establish a TCP connection.
Response timeout is exceeded.
Note: A notification is re-sent when there is an assumption that the problem is on the receiving end. Conversely, errors with 4xx codes mean that the problem is in the request itself (wrong authentication fields or other parameters), and sending the notification again is useless.
To see stream, probe or profile details, click on their names in the corresponding columns.
Telegram
The Telegram tab displays a journal of notifications sent in Telegram. The structure of the table in the tab is similar to the one in the E-Mail tab.
Recording
The Recording tab shows information about triggers that fired and initiated the recording of a stream. See the detailed description in the Recording Journal section.