
GraphView
GraphView allows you to control the basic QoS parameters of IPTV streams. You can use this view to compare multiple streams, e.g. the same stream at the input and output of a head-end station. The information is displayed as a table where data is updated dynamically. You can adjust the display of information and mute sound notifications using View Settings for all views.
If the number of streams can’t fit one page, the results are paginated. To move between pages, use a navigation bar below the table.
Tip
You can use tag filtering to compare two or more streams on one page by clicking the  button.
To do this, you need to assign the same tags to tasks beforehand.
button.
To do this, you need to assign the same tags to tasks beforehand.
The table comprises the following information:
Stream name ➀
Input bitrate ➁
IAT:MLR and MDI graphs ➂
Stream parameters ➃
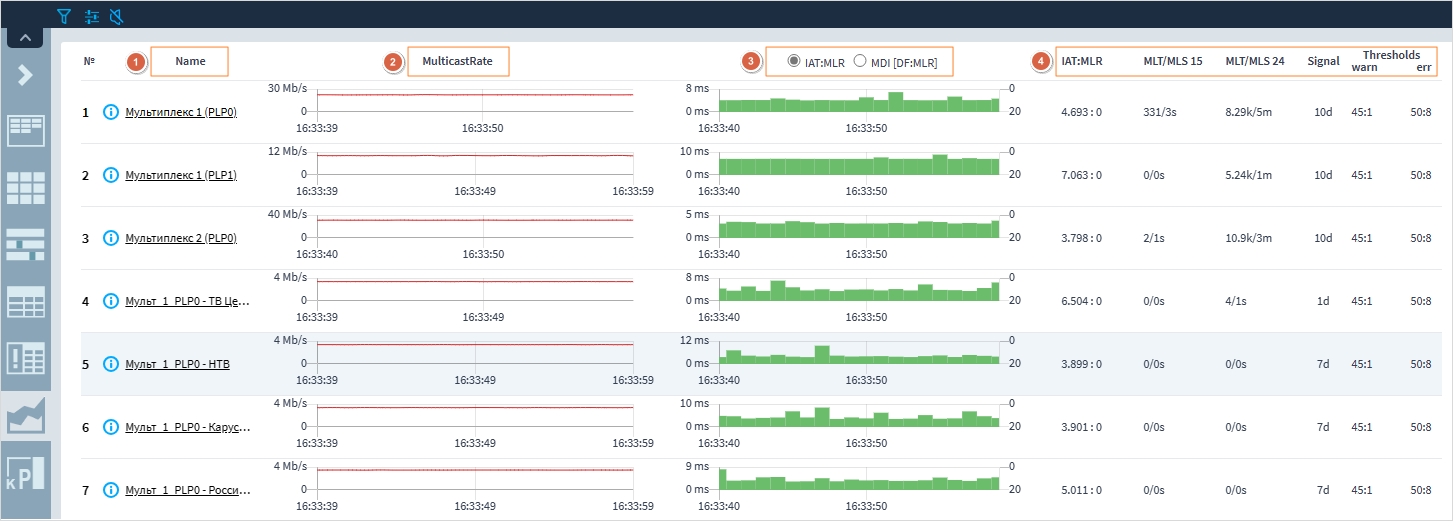
The Name column displays stream names.
If you click a name, a task page will open.
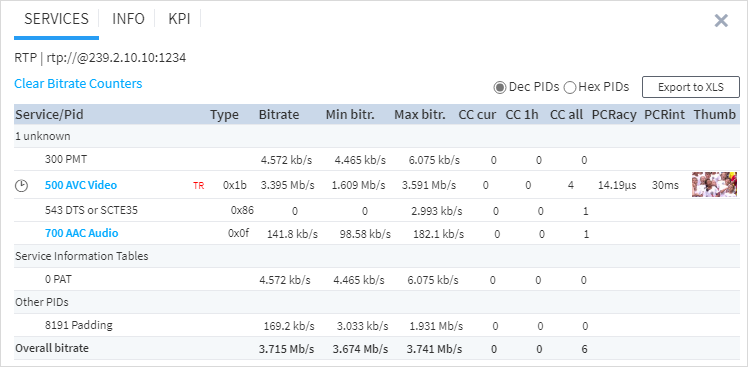
There is an icon  to the left of each stream’s name that opens a window with detailed information about a particular stream/service.
This window can contain task description, a PSI table for a stream, an OTT manifest, and other service information.
to the left of each stream’s name that opens a window with detailed information about a particular stream/service.
This window can contain task description, a PSI table for a stream, an OTT manifest, and other service information.
The MulticastRate column shows input bitrate as a 20-second graph. The actual bitrate is shown with a red line. When hovering the mouse over the line, you will see a pop-up hint with the bitrate value at a given moment of time.
In the next column, you can view IAT:MLR and MDI graphs. Use radio buttons to select the type of graph for display. When hovering the mouse over the graph, you will see a pop-up hint with data at a given moment of time. You can find the detailed description of graphs in the Graphs section.
The rest of the columns contain the following information:
IAT:MLR or DF:MLR — the current value of
IAT:MLRorDF:MLRMLT/MLS 15 — the current value of the MLT/MLS 15 metric
MLT/MLS 24 — the current value of the MLT/MLS 24 metric
Signal — the time elapsed in days (d) or hours (h) since this signal appeared
Threshold — warning and error thresholds that are set for IAT:MLR parameter in Project Settings ➝ Thresholds and Recording ➝ Thresholds
You can find a detailed description of parameters and metrics in the Parameters, Events and Errors section.