
MosaicView
MosaicView is designed to display channel thumbnails and consolidate tasks. If consolidation is used, the thumbnail is randomly selected from the streams group. IPTV tasks take priority. If the task analyzes an MPTS stream, the thumbnail is also selected from a random program of the stream.
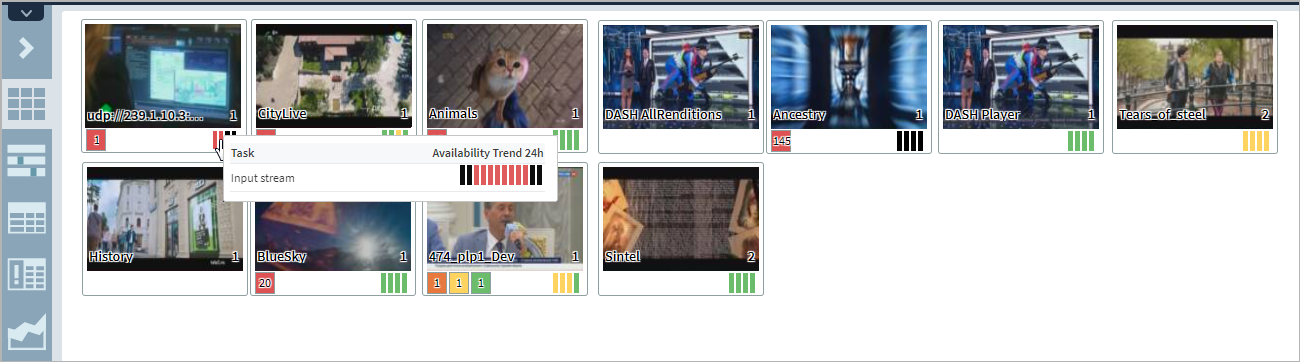
The following data is displayed in a thumbnail field:
Service name or Task name or Task URI — one of these fields is displayed depending on its availability. The fields are enlisted according to the priority level.
X — refers to the number of monitoring points grouped into a service (number displayed in the bottom right corner of a thumbnail).
Error flags — refers to a colored flag with a figure. The figure corresponds to the total number of active errors of similar level occurred in the consolidated tasks. The flag color defines an error level (from green to black). The level of errors displayed at MosaicView is set in the Alarm profile (Project settings ➝ Notifications ➝ ALARMS).
8-hour availability trend — displayed only for tasks with the enabled KPI profile. A graphical representation of the Service Availability state for the 8-hour monitoring period. One bar corresponds to 2 hours. A bar color corresponds to the color map of availability levels. A graph moves right to left, i.e., the rightmost bar shows the service state for the last 2 hours. When grouping several tasks, there will be a graph for a task with the most critical state. When hovering a graph, a popup window with 24-hour availability graph will appear. To go to the full statistics, click the graph within a popup window.
To open the Service window, click the thumbnail.
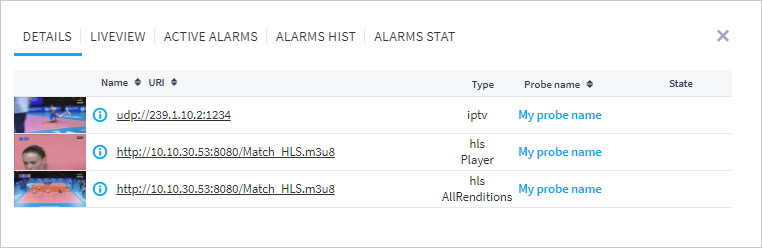
All consolidated channels are displayed when opening the Details tab. As shown in the picture, one IPTV and two OTT tasks are grouped, one task analyzes alternative renditions. To go to the required page, click the task or probe name. Flags of the active errors and their number are displayed in the State column
A channel live graphs are displayed at the Liveview tab (approximate period is 15 minutes). The graphics are stripes marked with errors and events. The graphs are updated every second. For OTT tasks in the all bitrates analysis mode, the total number of errors and events occurred in all bitrates is displayed at the same graph. Hover a cursor over an event or error mark, the event or error name is displayed. Go to the corresponding task page by clicking the graph. See more details on graphs in the LiveView section. On the stream thumbnail, there is the number of priority (TR1, TR2, TR3) for which the error was registered. If errors of several priorities appear, the most critical priority will be specified. For example, if TR1 and TR3 errors are registered for the stream, the thumbnail will display the TR1 priority.
The Active alarms tab displays active problems for the specified group of channels registered in the Alarm journal. Go to the corresponding pages by clicking the task or probe name. To go to the task page with error positioning on a graph (at the time of the event recording), click the time of the event record. Details of an error are displayed in a dialog containing detailed information on the trigger cause.
The Alarms hist tab displays non-active problems for the specified group of channels registered in the Alarm journal within the selected period (10 minutes, 1 hour, or 1 day). If required, displaying the particular trigger group can be configured via the filters of corresponding groups. Go to the corresponding pages by clicking the task or probe name. To go to the task page with error positioning on a graph (at the time of the event recording), click the time of the event record. Details of an error are displayed in a dialog containing detailed information on the trigger cause.
The Alarms stat tab displays summarized information on the quantity and duration of each priority errors (fired triggers) during the 15-minute and 24-hour interval.
Setting up the View
You can adjust the display of information and mute sound notifications using View Settings for all views.
To change the data representation, use the  button in the left part of the view. You can manage the display order and grouping of analyzed services.
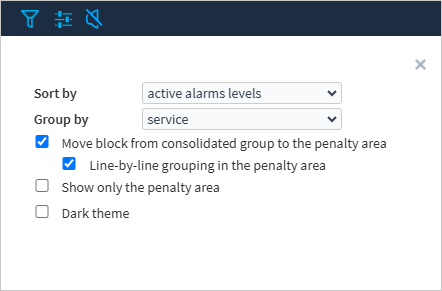
The tasks on the view can be sorted in the alphabetical order or by the active alarms severity levels via the Sort by button.
The Group by setting can be used to group tasks or consolidate tasks. Using this setting, you can group tasks by service, URI, name, or probe. If there are issues with streams, the entire group is moved to the penalty area, and the group’s block is painted with the color of the most severe event. You can change the order in which groups move into the penalty area as follows:
If you enable the Move block from consolidated group to the penalty area option, the blocks with issues will be excluded from the group and moved to the penalty area, and the rest of the group remains in the green zone.
If the Line-by-line grouping in the penalty area box is ticked, then when an error is registered on one of the services, the entire group will be moved to the penalty area. In this case, the streams with no errors will be grouped on the left side of the line. Streams with errors leave the group and are placed to the right; they are sorted by the error severity level. When another group has a problem, it is placed on a new line in the penalty area.
Note
The effect of these settings is more clearly illustrated in the diagrams in the BlockView description.
When the Show only the penalty area option is enabled, the view will display only the services with errors. Once the error has been resolved, the service will disappear from the penaly area.