
KpiView
Overview
KpiView represents statistics about number of registered errors during last 24 hours, availability metrics and loss amount. This allows accessing the broadcasting quality and apply measures for its enhancing. There is the possibility to create and send regular (daily, weekly) reports that are essential for work of the service quality department.
Note
To calculate and display the Service Availability, it is necessary to apply the Availability profile in the settings of each task.
You can adjust the display of information and mute sound notifications using View Settings for all views.
By default, KpiView displays all project tasks. To exclude from the list some tasks, that are not assigned with the Service Availability profile, click the ![]() button and enable the setting Show only streams with KPI profiles enabled.
button and enable the setting Show only streams with KPI profiles enabled.
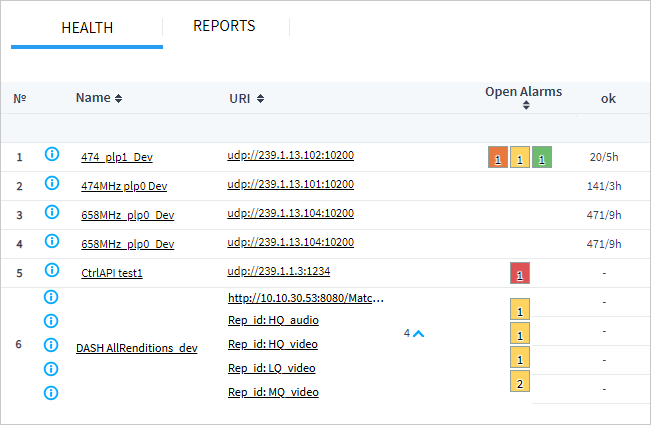
Health Tab
In the Health tab, there is information about quality, duration and severity of problems on each monitored service. By default, the page is static, the data is not updated. This ensures that all the statistics are captured at the opening of page. And thus, you can thoroughly study and compare monitoring information. To update statistics, click the Refresh button. If required, you can automatically refresh data every 5 or 30 seconds.
Project tasks are grouped into a list that can be sorted by a name, URI, or by the number of active alarms. To arrange tasks, click the sorting button in the corresponding column. Please note that sorting will be within one probe tasks.
Note
When monitoring HLS, DASH, SRT and other protocols, Elecard Boro can create several subtasks. By this reason, Service Availability and other parameters are calculated for each component of the analyzed service, as well as for a parent task (e.g., manifest analysis task). When a service field is collapsed, the summary values for all subtasks are displayed.
In the Health tab, the following parameters are registered:
Active Alarms
Log of registered Alarms
No signal
Video freeze
Audio silence
Packets loss
Service Availability
Listed data is represented as statistics for the last 24 hours or 15 minutes that allows estimating the service recovery process after fixing accidents. If the further analysis is required, or if statistics should be saved, the tables can be exported in the XLS file.
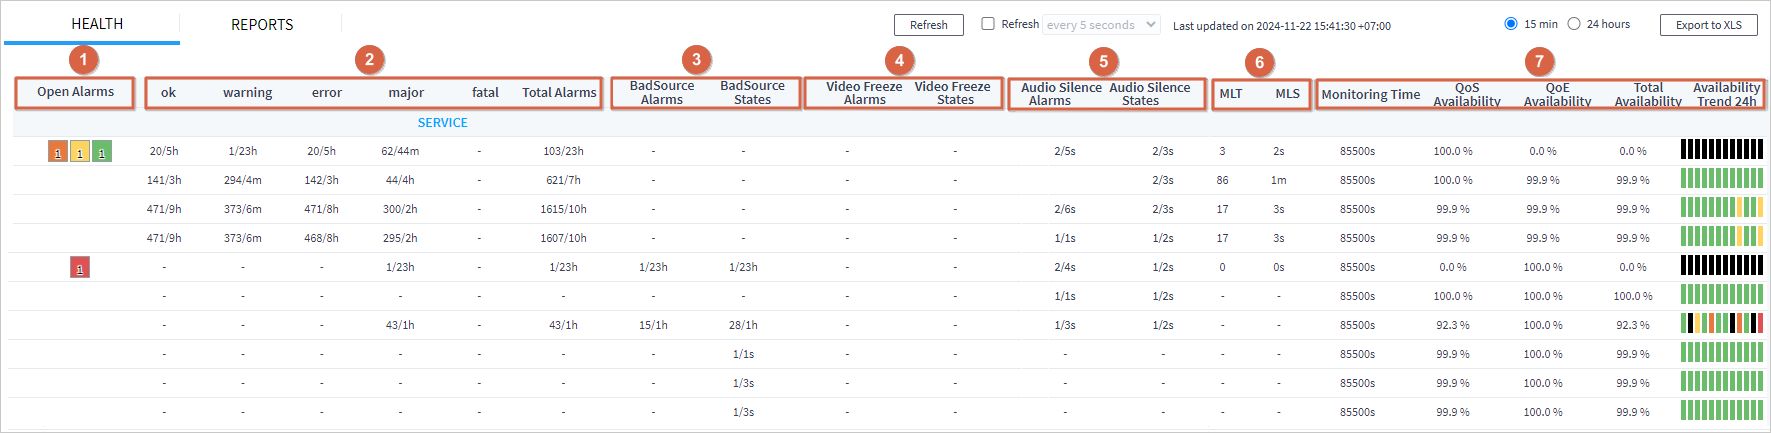
Active Alarms
In the Open alarms ① column, there are active alarms displayed as the coloured cards. A card color corresponds to the alarm severity level, while the digits indicate the number of active states. To view information about active alarm, click the coloured card. The window with alarm details will open:
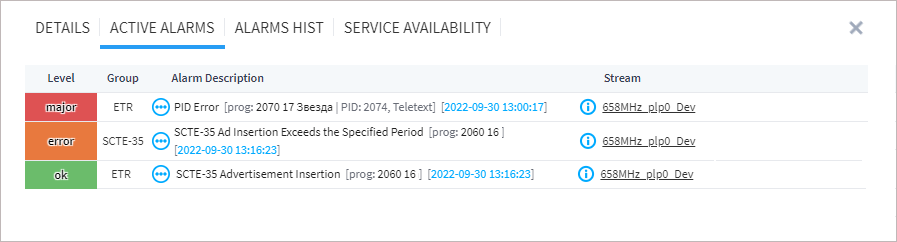
To view all registered alarms, go to the Alarms History tab. Use radio buttons to switch display intervals (15 minutes, 1 hour, or 24 hours).
Alarms Statistics
In the Health tab, the next group of columns ok .. fatal ② contains information about number of firing alarms and their total duration spaced by different severity levels. The total duration is calculated in accordance with the following conditions:
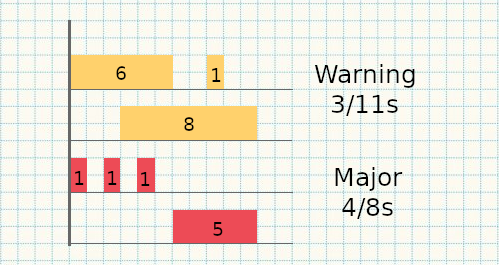
Triggers are grouped by the severity level and metrics are calculated for each of groups.
If periods of trigger firing are not overlapped, then duration of each period will be considered (see the example of the Major level).
If periods of trigger firing are overlapped (see the example of the Warning level), then the total duration will be calculated considering overlapping of active trigger states. In this way, the total duration cannot exceed the monitoring period, even if some triggers of the group will be active all the time.
Signal Loss
Information about the Bad Source ③ is separately registered, since this is the critical error. In the BadSource States column, there is information about states when the signal is actually absent. It is the raw data from the probe that is not processed by the notification system. Such data is logged in TASK EVENTS journal on a task page. In the BadSource Alarms column, there is number of the BadSource (No signal) trigger firing and its summary duration. Values in the the BadSource Alarms column can be less than statistics for states, since the trigger has a configured firing threshold. You can find more detailed information about states and triggers in the Describing System Operation chapter.
Both metrics are essential for estimating the service state. For example, you can estimate the number of short signal breakdown (less than the threshold), as the delta between the number of states and alarms.
Video Freeze
In the Video Freeze ④ columns, the number of Video Freeze alarms and states are registered as well as their total duration for the selected monitoring period (15 minutes or last 24 hours). Click the table cell to view detailed information about active or all registered Video Freeze states at intervals of 15 minutes, 1 hour or 24 hours.
Audio Silence
Audio Silence ⑤ columns displays the number of Audio Silence alarms and states as well as their total duration for the selected monitoring period (15 minutes or last 24 hours). Click the table cell to view detailed information about active or all registered Audio Silence states at intervals of 15 minutes, 1 hour or 24 hours.
Packets Loss
Packet loss ⑥ measurement can be applied only to IPTV services and it is evaluated via the following metrics:
MLT (Media Loss Total) — the total number of media packets lost for the selected inspection period.
MLS (Media Loss Seconds) — the period of time in seconds during which packets were missing within the selected inspection period.
Metrics are intended for assessing the scale of losses in the quantitative terms as well as the interval during which losses occurred. Multiple losses occurring on the short interval would be considered less critical than regular packet losses (MLS high value).
Service Availability
Service Availability ⑦ is a statistical value that represents the provided service quality as a numerical expression. The detailed metric interpretation is given in the Service Availability section.
The Monitoring Time column displays the monitoring duration for the selected inspection period (15 minutes or the last 24 hours). Time begins to count from the task start, and paused when the task is stopped, or when the probe is stopped or restarted. If the monitoring task did not stop, and probe — server connection remained stable without any interruptions, then monitoring time amounts to 24 hours.
Error time is the total time of Error Seconds that the probe registered during the service monitoring. Availability triggers are divided into two groups QoS and QoE, thus the Boro system calculates three types of metrics: QoS Availability, QoE Availability and Total Availability. This grouping enables us to identify more accurately what area is affected with a problem. As with the alarm statistics, availability is calculated together with overlapping of the selected triggers including the total availability.
To view availability graphs for 24 hours with detailed statistics for each 15 minutes, click the value in the any availability column.
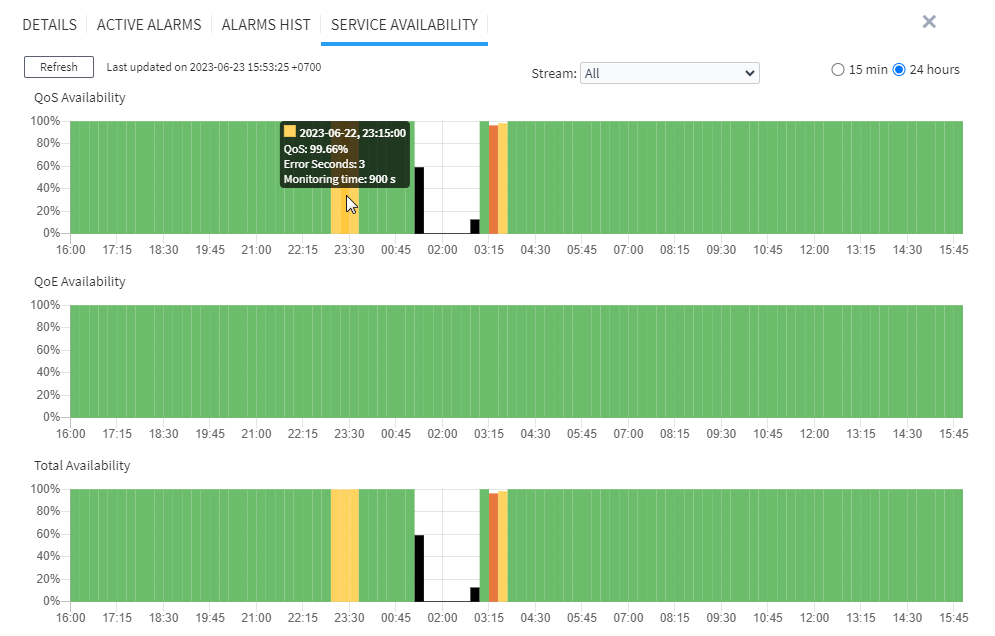
In the Service Availability window, there are three graphs: QoS Availability, QoE Availability and Total Availability. Each graph has 96 15-minute bars — rectangles. A rectangle color defines the Service Availability level at a certain moment, while its height corresponds to the availability percentage. The bar color complies with the color map of the Availability levels set at the General Settings ➝ KPI ➝ Service Availability. When hovering the bar, the tooltip will pop up containing the following information: registration time, availability percentage, number of Error Seconds, and monitoring time.
Availability Trend 24h displays changing of service total availability for the last 24 hours of monitoring:
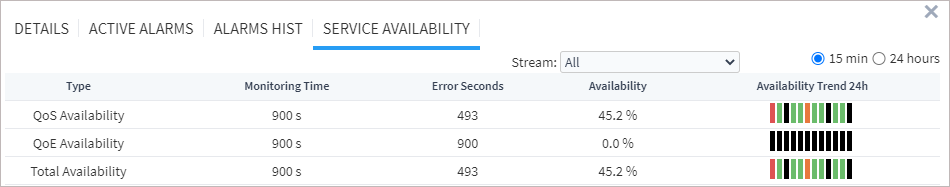
One bar corresponds to 2 hours. A mini graph moves right to left, i.e. the rightmost bar shows the service state for the last 2 hours.
Reports Tab
In the tab, you can create a one-time or schedule a regular report. This can help you to automate the process of broadcasting monitoring. Each report is the XLSX file and includes the statistics for the following metrics:
Service Availability
BadSource (No signal)
Packets loss
Summary for registered Alarms
Report Creation
To create a new report, use the Create new report action. In the opened report builder, specify a Report name that will be used for an archive and report mails.
You can select statistics that should be included in the each report. Description for each statistics type is given earlier in the Health Tab section.
Next, select options that should be used for the report creation:
Show statistics for — selecting probes statistics of which should be included in the report. Using the setting, you can select all project probes, add or exclude some probes. When selecting options of adding or excluding probes, a dropdown list will appear where you can select probes. To select several probes, sequentially click each probe and they will be highlighted with the yellow color.
Group tasks by — the way tasks should be grouped in the report. You can group tasks by: probe, service, name, uri.
Show OTT tasks statistics — the way of representing OTT tasks in the report. When selecting for every rendition option, the report will include statistics for each variant stream. While selecting only total number option, only total statistics for all variant streams of the service together with states overlapping.
The Report sending frequency section species the report period. By default, the report is created once for the last 24 hours. You can specify your own period or select the predefined periodicity (last day, yesterday, three days, last week).
For creating regular reports, the following options are available:
report for the last day — creation of everyday report for the previous 24 hours.
report for the last 7 days — creation of weekly report for the previous week.
In the dropdown list of each option, you can set up a convenient schedule for report creation with the 15-minute interval.
In the Sending settings section, the following settings can be configured:
Language and Timezone
Color Service Availability values when thresholds are exceeded — change a color of the value cell in accordance with the color map of the Availability levels set at the General Settings ➝ KPI ➝ Service Availability.
Archive reports to ZIP file — the option is necessary to compress data when creating a report for a long-time period for many tasks.
In the list of recipients, there are emails of people who have been granted access to this project. To send a report to a new user, you must Share Project in the project settings first.
When parameters are set, and the report is scheduled, KPI report will be created when a preset time occurs.
For Boro Solution
Except for email sending, report can be uploaded via SFTP and FTP protocols. You need to configure FTP/SFTP access parameters, at the Project settings ➝ General Settings
Scheduled Reports
When creating regular report in the builder, a record of the upcoming job is formed. Single reports will also be included in the list of upcoming jobs; however, but after the report is generated, the record is deleted. For each job, there is information about the time left before the report generation, report frequency, and report period.
In the Actions column, there are the following tools for managing jobs:
Create now — immediately create a report. In this case, a weekly report won’t be comprehensive since it period does not cover the set duration. FYI: a regular report will be also created at the scheduled date.
Pause — postpone the report creation. The job will be paused until the user restores the report creation.
Edit — make changes in the settings of a scheduled report.
Delete — delete a report-creation job.
Reports History
In the reports history, created reports are displayed. As soon the job is finished, the report will be included in the history. The created report can be sent once again to email, downloaded locally or uploaded to the SFTP/FTP server (the Actions column). Reports are saved on the server within the set storing period (14 days by default).