
LiveView
LiveView is designed to visually control the state of analyzed streams in real time. The analysis tasks are shown as dynamic stripes, indicating registered issues or events. Stripes are updated each second.
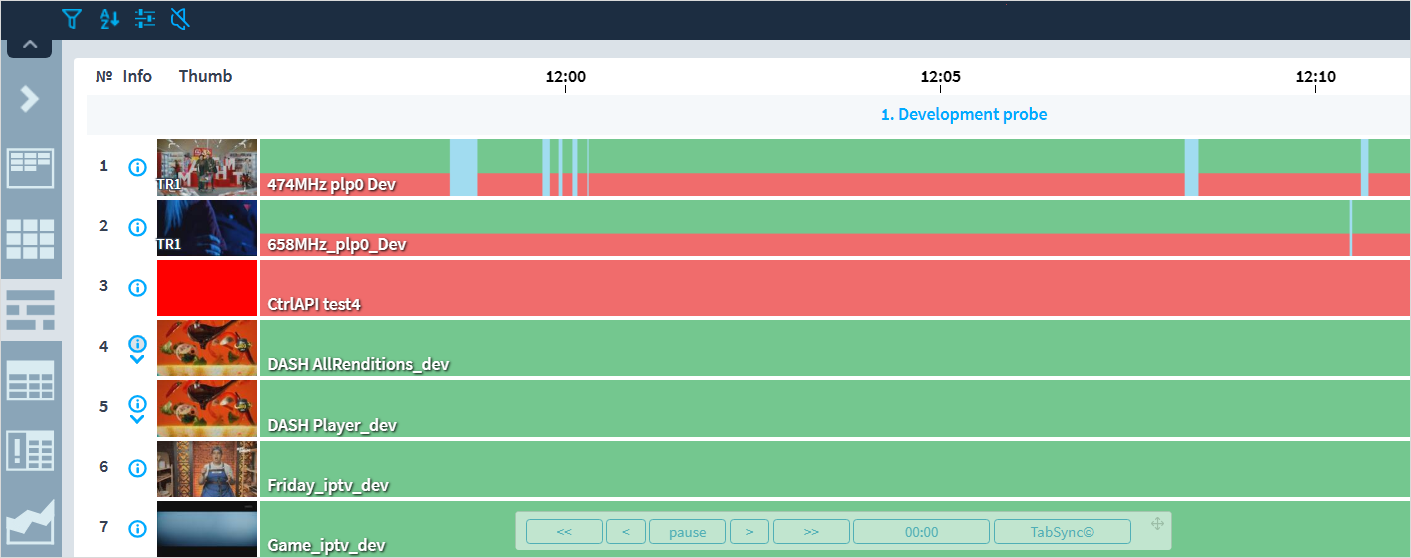
By default, the tasks are grouped by probes. If you click on a probe’s name, a page with detailed information about this probe will open.
There is a thumbnail area in the left part of the screen. Thumbnails are displayed if the Thumbnails capture setting is enabled. You can enlarge thumbnails by clicking on them. If thumbnails are captured, but there is a lock icon instead of an image, this means the stream contains encrypted PIDs. In case ETR 101 290 errors are registered, the stream thumbnail will display the number of priority (TR1, TR2, TR3). If errors of several priorities appear, the most critical priority will be specified. For example, if TR1 and TR3 errors are registered for the stream, the thumbnail will display the TR1 priority.
There is an icon  to the left of each stream’s thumbnail that opens a window with detailed information about a particular stream/service.
This window can contain task description, a PSI table for a stream, an OTT manifest, and other service information.
to the left of each stream’s thumbnail that opens a window with detailed information about a particular stream/service.
This window can contain task description, a PSI table for a stream, an OTT manifest, and other service information.
If a task of OTT or SRT service analysis has subtasks, its stripe on the graph will show aggregate issues for all subtasks, including the parent task of manifest analysis.
For those analysis tasks that have subtasks, there will be  icon below the information icon.
If you click this icon, the list of all subtasks will expand.
icon below the information icon.
If you click this icon, the list of all subtasks will expand.
The major part of the screen is occupied by moving stripes. The color of stripes shows the state of analyzed streams:
██ — Ok — no registered states or events
▒▒ — Stopped — [white] the task is stopped (the task will disappear after the page is updated)
██ — Server lost connection to the probe — the server cannot connect to the probe
- ▒▒ — Undefined state — [white] there are insufficient data to determine the state. This can be caused by the following:
for some reason, the DB has no data for the given interval;
the connection to the probe is lost or the probe was stopped incorrectly;
the task was stopped correctly, but the information about stopping is beyond the boundaries of this data segment (due to specifics of data storage optimization).
██ — No signal — a source error; the probe cannot receive data for analysis
██ — Several broadcasters — several broadcasters are detected in the same group
██ — Video freeze — a video freeze is registered
██ — Download bitrate low — the segment download speed is low (the download speed goes below the warning threshold)
██ — TR101290 (PID error) — the data for the specified PIDs does not occur during the specified period
██ — TR101290 (Audio/video PID error) — the data for the specified audio and video PIDs does not occur during the specified period
██ — Task has no subtasks — HLS or DASH has only a Manifest task and doesn’t contain any subtasks; the task analyzing a SRT stream has only a Master task and doesn’t contain any subtasks
When an event is registered, a vertical bar appears on the graph:
██ — Timestamp discontinuity — detecting the discontinuity of timestamps (PTS/DTS for MPEG-TS) when the absolute difference of timestamps values exceeds the set threshold
██ — CC error — loss of transport packets
██ — PAT error — the 0x0000 PID does not appear every 0.5 seconds (configurable parameter)
██ — PMT error — the section with table_id 0x02, i.e. PMT table, does not occur every 0.5 seconds (configurable parameter) on the PID that is assigned for this purpose in the PAT table
██ — TS sync loss — two or more successive Sync_Byte_Errors are detected; the error disappears after five or more successive sync bytes are received (synchronization is achieved again)
██ — Sync byte error — a sync byte 0x47 is missing in the successive packet (after 188 or 204 bytes)
██ — Playlist loading failed — the playlist cannot be downloaded
██ — Segment loading failed — the segment cannot be downloaded
██ — SCTE-35 — a SCTE-35 timestamp is received
If you hover the mouse over the stripe area, you will see a line that is a vertical cursor. When moving along the graph, you will see the names of states and events on all stripes in the area where the cursor is. If you pause, you will also see the time to which the cursor indicates.
When clicking a stripe, you will see a page of the analyzed task with all the graphs and journals of the task positioned by the chosen time. If you click the name of a task on a stripe, the page of this task will open without graph positioning.
You can adjust the display of information and mute sound notifications using View Settings for all views.
In the settings, you can also enable or disable an additional control panel by checking or unchecking the Show the floating control panel box. The panel allows you to pause the update of graphs or go to a certain time moment back and forth.

The panel can be placed in any part of the screen. To move it, hover the mouse over the drag-and-drop icon in the upper right corner of the panel, press down the left button of the mouse and move the panel to the desired place.
The panel contains the following buttons:
pause — stops the update of stripes.
< > — rewinds or fast-forwards graphs by 5 minutes, pausing the update of stripes. To go back to the current time and start the update again, click the pause button.
<< >> — rewinds or fast-forwards graphs by 10 minutes.
00:00 — lets you specify an exact date to position to. When you click the button, you will see a calendar where you need to select the required date, specify a value in the Time field, and click the Go button. To go back to the current moment in time, click Now.
TabSync© — designed for synchronizing LiveView with other tabs based on the TabSync© technology. You can see the detailed information in the Tab Synchronization section.