All Probes page
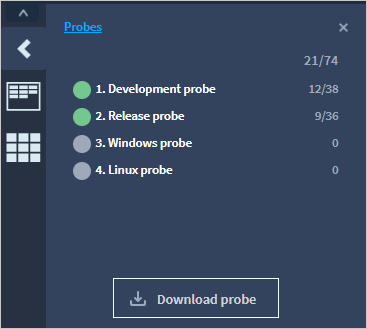
The page contains consolidated information on all project probes and their management tools. On the page, you can check the number of active tasks and license usage (in total and individually for each probe). If you use the Boro cloud service, you can check the licensing rules in the Plan and payment section or in the License Agreement on the company’s website. For Boro Solution, you can find the licensing rules in the Elecard Software End User License Agreement.
To go to the all probes page, open the side panel and click the Probes action. Additionally, the side panel contains the Download probe button, allowing you to get a new probe.
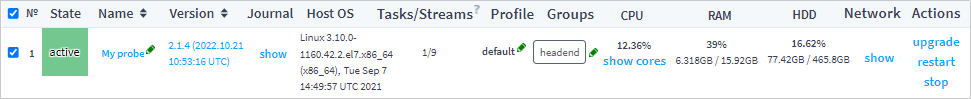
Active probes
The Active Probes section allows you to control and view information about running probes.
Column |
Purpose |
|---|---|
Status |
Probe state. For the running probe, the status active is displayed. |
Name |
A probe name, when clicking on which, its page will open. |
Version |
Probe version. To view the history of a probe updates, click the version. |
Journal |
Probe events journal, contains history of starts, updates, and probe stops. To view a journal, click the show. |
Name and host OS |
Information about hostname and operating system of the server on which the probe is running. |
Tasks/Streams |
The probe license information, displays the number of tasks and streams. |
Profile |
The name of the probe system profile. Click the pencil icon, to assign another profile to a probe. To create a new profile, open the page “Project settings” ➝ “Probe profiles”. |
Groups |
Groups assigned to the probe with the aim to share access between users. To add new groups, click the pencil icon and fill in names of groups separated by spaces. |
CPU/RAM/HDD and network usage |
System resources statistics can be used for controlling the system resources for each probe. This allows for taking timely necessary measures to maintain the performance of the systems on which the probes are running. To view statistics for using logical processors, click core utilization. |
Network |
Statistics for network usage. To view statistics, click show. |
Actions |
Instruments for controlling the certain probe: upgrade, restart, stop. |
To restart several probes simultaneously, select the necessary probes and click the button restart. In the opened window, confirm restarting.
To upgrade multiple probes at once, select the probes and click the Upgrade button. Then click the version that should be used and click the Upgrade button. Please note that developer versions may be available in the separate list. You can only upgrade the probe to the unofficial version on the all probes page.
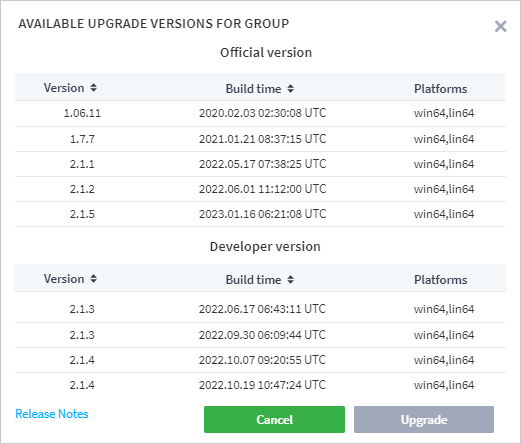
After confirming the probe upgrade, the probe will be upgraded to the selected version and restarted.
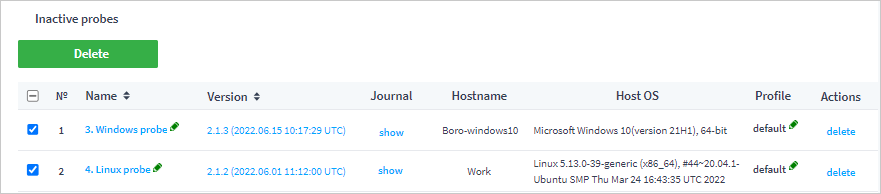
Inactive Probes
Once probes have been stopped, they are displayed in the Inactive Probes section.
For each stopped probe, you can view information about the hostname and operating system of the server on which the probe is running. Information about the probe start and events history are saved in the probe journal.
To exclude the stopped probe from the probe’s list in the side panel, delete it from the Inactive Probes list.