
Probe Configuration
When you manage the probe: set the analysis tasks, change the analysis parameters and perform other actions, the probe saves all settings in the configuration file. The configuration can be saved on the server, e.g. as a backup copy. You can modify the saved configuration and export it to a file. You may apply any saved configuration to the running probe or copy the configuration of other running probe. In some cases, the server automatically saves the configuration.
Note
We recommend to save configuration backups on the server rather than copy the monitor.cfg file.
To go to the probe page, click the probe name in the left sidebar.
The following configuration managing tools available on the page:
Apply probe configuration — to choose the configuration backup, copy the configuration of other running probe or import from a file;
Save probe configuration — to save the current probe configuration on the server or export it to a file.
Saving the Current Probe Configuration
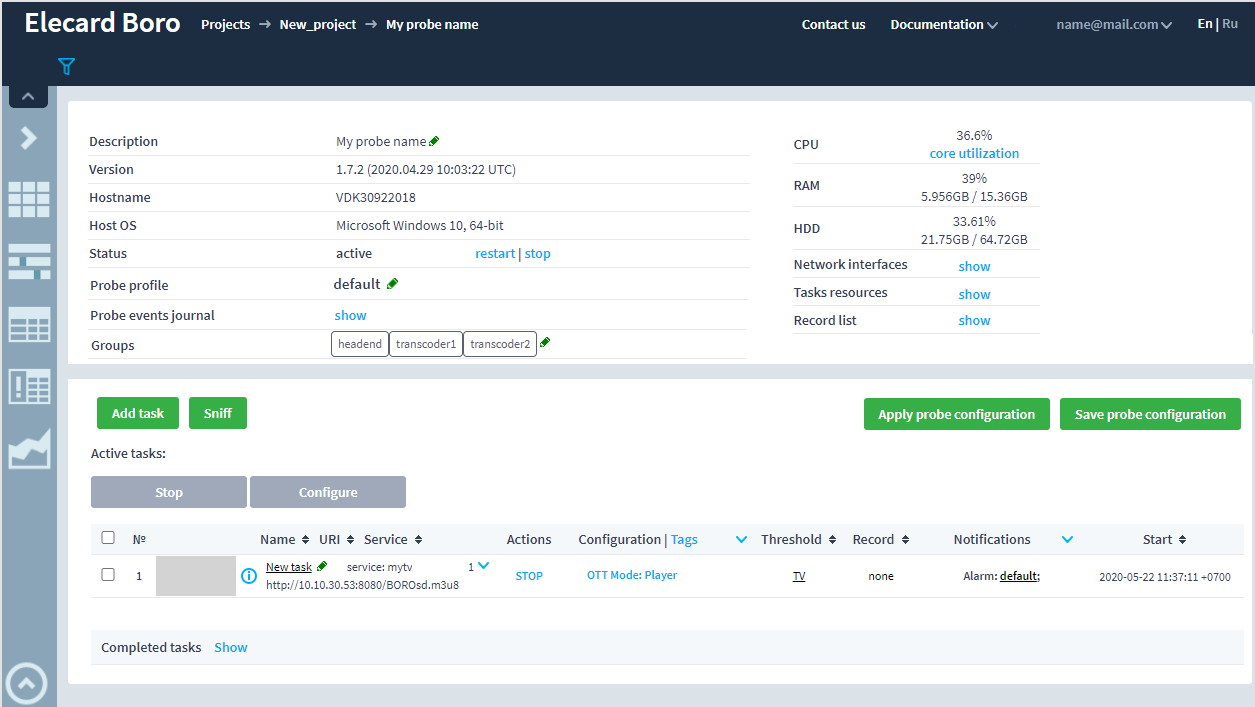
By clicking the Save probe configuration button, the corresponding window will appear:
Fill in the Name field. To save the configuration, use one of the following buttons:
Export to file — to export the configuration in the CSV format and download on the computer;
Save — to save the probe configuration on the server.
Applying the Configuration
Viewing the Configuration
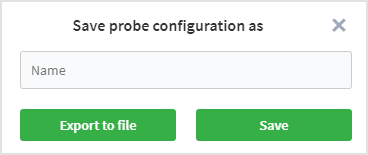
After clicking the Apply probe configuration button, the Choose probe configuration window will be opened:
The list of configurations related to the current project is displayed by default. To view other configurations, select the required project in the Show all probe configurations from project drop-down list. The “all” option displays all available configurations. The window also contains the following information: a configuration and probe name, a creation date, a number of tasks, the configuration state information. When the server automatically saves the configuration, it may have one of the names presented below:
auto_save(probe update) — the configuration was saved by the server before the probe update;
auto_save(License) — the configuration was saved before tasks were stopped because of the service suspending.
The following configuration states are possible:
Current — the current configuration of the running probe;
Saved — the configuration was saved on the server;
Imported — the configuration was imported from the file.
To sort the table records, click the required column name.
For the Action column, the following buttons are available to manage the configuration:
— to view and edit the configuration;
— to export the configuration to a CSV file;
— to delete the configuration.
Click the pencil  to change the configuration name. To save a new name, press Enter.
At the bottom of the window, the following buttons are present:
Import from file — to import the user configuration from file. Requirements applied to an imported configuration are detailed in the Importing and Exporting the Configuration File section;
Cancel — to cancel changes and close the window;
Show — to view and edit the configuration. The button is inactive till you choose the configuration.
View and Edit the Configuration
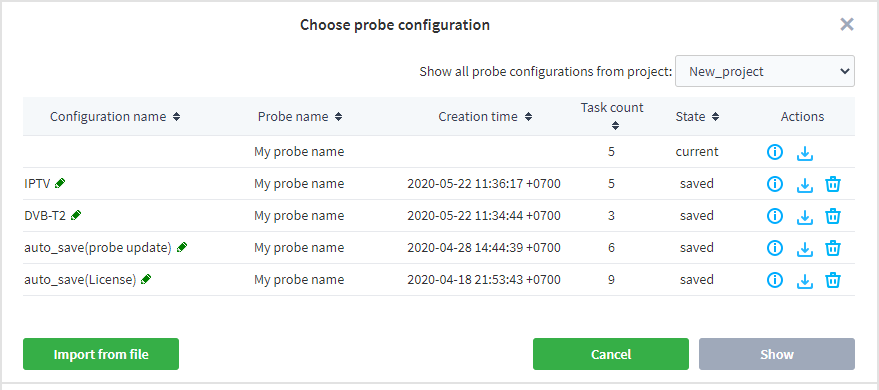
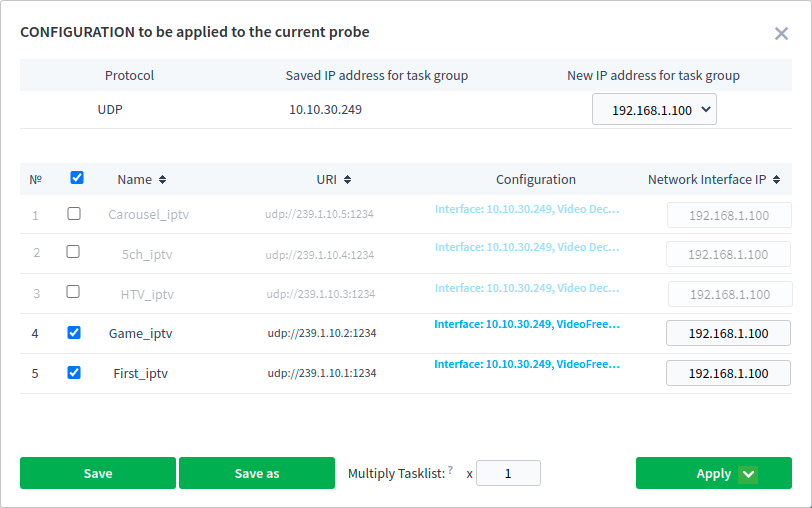
To view the information about a certain configuration, click the Show button. The Configuration to be applied to the current probe window will appear:
The middle of the page contains the following information about tasks:
№ — an ordinal number of a task;
Name — a name of the analysed stream (a task name);
URI — an address of the analysed stream;
Configuration — a description of the task configuration;
Network Interface IP — an IP address through which the probe receives the stream. You can specify the required interface IP address. If not specified, the probe will receive data according to the routing table.
To sort the task list, click the required column name.
There is a handy tool for editing the interfaces, at the top of the window. While opening the window, the task list is grouped by the protocol and IP of the assigned interface. The table allows to reassign the interfaces. It significantly simplifies the work, when you copy the configuration from one probe to another.
Protocol — protocols of streams in the configuration;
Saved IP address for task group — IP address of a group of tasks in the saved configuration;
New IP address for task group — the field is used to assign a new IP address.
To view or to edit the configuration of a certain task, click by its details in the Configuration column. In the opened window, you will find the information about tags, settings and notification profiles, QoE and QTT options.
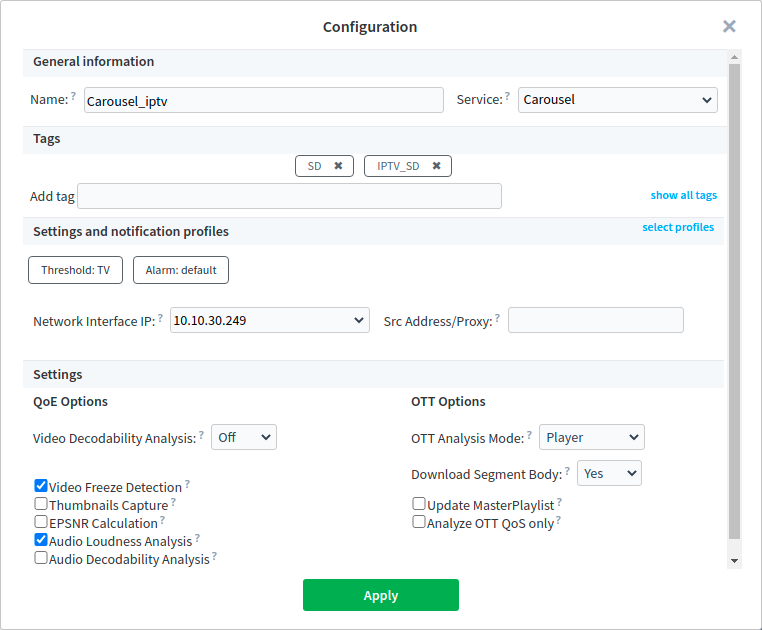
This window is identical to the Add task window and the Configuration window. To get more information about a certain setting, use pop-up hints. By clicking the Apply button, made changes will be applied to a task.
Apply or Save the Configuration
Return to the Configuration to be applied to the current probe window. To save and/or apply an updated configuration, the following buttons can be used:
Save — to save changes in the current configuration;
Save as — to save a copy of the configuration. The dialog window for specifying a configuration name will be opened;
Apply — to apply the configuration to the probe. To apply the configuration, click OK in the confirmation window. When you click the button, you must choose whether to add configuration tasks to the current tasks or to replace the current tasks.
Attention
When applying the new configuration, all active probe tasks will be stopped without saving the current configuration. If necessary, make a current configuration backup.
The Multiply option allows multiplying the configuration by a specified coefficient. This option is used to perform load and stress tests on a distribution server.
You can select which tasks contained in the configuration should be saved or applied. When opening the configuration all tasks are selected by default. To exclude a task, uncheck the task box. The excluded tasks are dimmed. Once the tasks are sorted, you can overwrite the configuration, save it as new, or apply the changed configuration to a probe.
Importing and Exporting the Configuration
Working with configuration in the CSV format provides an opportunity to configure tasks in spreadsheet editors such as MS Excel, LibreOffice Calc and other. If you save the channel plan as a table, it would be enough to format the table as required and apply it to the probe.
Due to Microsoft Excel not displaying the delimiter selection window when importing a CSV file (hidden settings are in use), an optional sep=; line was added to the configuration file.
Placed in the first string, this directive tells the program to use the ; (semicolon) character as the delimiter.
Depending on the program used, this line may or may not be displayed in the edit window.
Import
You can import the configuration from a CSV file, if its structure is subject to the following requirements:
a file is saved as UTF-8 encoded;
a file contains no less than two rows: a column header row and at least one row containing task details;
the
urifield is mandatory, other fields are optional;fields are separated by
;(a semi-colon) delimiter. Thesep=;delimiter directive may be specified as the first string in the file;fields containing a semicolon, double-quote or commas should be surrounded by a double-quote
". If double-quotes are used in the fields, then a double-quote must be represented by two double-quote characters;fields may be specified in any order.
Specified below fields should not contain the following symbols:
a task name (name):
"<>a profile name (profiles):
",:<>a service name (service):
",;<>tags name (tags): a whitespace character and
",;<>
When importing, spaces and special characters at the beginning and end of the line are removed for all values.
The correspondence of fields in the CSV file with the names of settings in the Add task window is given below. Please note that some field values may differ from those in the web interface.
uri — URI of an analysed source;
name — a task name;
interface — Network interface IP;
proxy — Proxy (to receive data when analysing OTT service);
igmpSourceFilter — Source IP. IPv4 addresses of individual broadcasting sources for IPTV tasks (only for IGMPv3). Several addresses should be separated by comma
,;- profiles — Thresholds, Recording and Notification profiles. The field is specified as a list of elements in the format <key>:<profile name> separated by comma
,. The list of keys:threshold— a threshold profile;record— a recording profile;alarm— an Alarm notifications profile;email— an e-mail notifications profile;snmp— an SNMP notifications profile;telegram— a notifications profile to the Telegram messenger;pagerduty— a notifications profile to the Pagerduty system;webhook— a WebHook notifications profile. tags — Tags. A list of tags separated by comma
,;service — Service;
- VideoDecodability — Video Decodability Analysis. Available values of the field:
off— the metric is disabled;lite— semantic analysis of an elementary stream without further decoding;full— full decoding. Freeze — Video Freeze Detection. Available values of the field:
trueandfalse;ColorBars — Detects a test pattern, i.e. color bars, in the sequence of frames. Available values of the field:
trueandfalse;BlackFrames — Detects a sequence of black frames. Available values of the field:
trueandfalse;ConstantColorFrames — Detects a sequence of constant-color frames. Available values of the field:
trueandfalse;Thumb — Thumbnails Capture. Available values of the field:
trueandfalse;- ThumbPeriod — Thumbnails capture interval during the program broadcast in seconds. Available values of the field:
off— disables the thumbnail capturing;allIFrame— the probe will capture thumbnails from each keyframe;<Interval>— specifies the interval between thumbnail captures in seconds. - ThumbFreeze — Thumbnails capture interval during the video freeze in seconds. Available values of the field:
off— disables the thumbnail capturing;startEnd— capture thumbnails at the beginning and at the end of the event (for the video freeze period only);allIFrame— the probe will capture thumbnails from each keyframe;<Interval>— specifies the interval between thumbnail captures in seconds. - ThumbSCTE35 — Thumbnails capture interval when ad is detected (SCTE35 period) in seconds. Available values of the field:
off— disables the thumbnail capturing;allIFrame— the probe will capture thumbnails from each keyframe;<Interval>— specifies the interval between thumbnail captures in seconds. AudioLoudness — Audio Loudness Analysis. Available values of the field:
trueandfalse;AudioDecodability — Audio Decodability Analysis. Available values of the field:
trueandfalse;- OTTmode — OTT Analysis Mode. Available values of the field:
AllRenditions— the analysis mode of all Alternative Renditions of all Variant Streams;Player— the “Player” mode. The probe uses a standard algorithm inherent to OTT media players, i.e. the probe downloads and analyses the Variant Stream with the highest bitrate allowed by the network bandwidth at this time. UpdateMaster — Update MasterPlaylist. Available values of the field:
trueandfalse;sniff — Start a task in the Sniff mode. Available values of the field:
trueandfalse;T2MIEnable — Enable T2-MI Analysis. Available values of the field:
trueandfalse;T2MIAnalyzeTs — Analyze transport streams encapsulated into T2-MI. Available values of the field:
trueandfalse;T2MIPID — The container stream PID carrying the encapsulated streams in T2-MI. Value in the decimal or hexadecimal format.
json — The field is used to set parameters in the JSON format. The field prevails over the settings described above. Data structure, parameter names and its values are given in the Task Configuration. Before you import the file, ensure that data in this field is compliant with the JSON format.
To get more information about each setting, use pop-up hints in the Add task form. If there is no field or its value specified, the corresponding metric is considered to be disabled or to be set with its default value (see Task Configuration). You may apply most of the parameters to already running tasks (after the configuration import) by changing settings of a task group via the browser, except for: URI, OTT Analysis Mode, Enable T2-MI Analysis and Analyze Encapsulated Streams.
If the import has succeeded, the Configuration to be applied to the current probe window will appear.
Errors When Importing the Configuration
Attention
The error occurs when importing the configuration, if other than ; (semi-colon) symbol is used as the delimiter.
Other scenarios preventing the successful import of the configuration file:
Column headers contain unknown fields;
Column headers differ in number from row fields containing tasks parameters;
Incorrect data in the json field.
Export
You can export the configuration in the following ways:
- Export the current configuration.On the probe page, click the Save probe configuration as button, enter a required name for the configuration and click the Export button. The configuration will be downloaded in the CSV format on the computer.
- Export the previously saved configuration or export the configuration from other projects.On the probe page, click the Apply probe configuration button. In the opened window, choose a project from which the configuration should be exported. Next, in the Actions column, click. The configuration will be exported.
Note
Passwords for SRT tasks won’t be included in the exported configuration file.
The first string in the file is sep=;.
This directive signals certain spreadsheet editor programs that the ; (semicolon) character will be used as the delimiter.
After the export has finished successfully, you may import the configuration and apply it to existing probes.