
4.3. Recording
Broadcast monitoring in real time implicates the control of the current service state. Service recording functionality allows capturing a stream at a given moment of time when detecting a certain state. A stream or an OTT service can be manually recorded or recorded automatically by a preconfigured trigger firing.
A downloaded IPTV record file is a ZIP archive including a stream dump or Pcap data and a detailed description of a triggered event in the JSON format. An OTT record file contains sets of objects (playlists, segments, initialization files) which are organized in folders and a JSON description of the record structure, i.e., when recording the OTT service, the probe captures a stream retaining the original service structure (instead of seamless stream recording). Recording the OTT service depends on the analysis mode: in the All renditions mode, all available media representations are recorded while in the Player mode the probe records only those representations that are currently analysed.
Key features:
Recording by any trigger of the system;
Pcap recording;
Recording the entire structure of HLS and DASH services;
Fill description of a record in the JSON format;
Simultaneous recording on several probes.
Manual Recording
To manually record the stream, go to a required task and click the Record action. Set the desired record duration and press the Manual recording button. Now, as the recording is started, you can see the recording progress in the list below. You may abort the process by clicking the stop action. Once the recording is finished, you may download the record archive in the required format, just click the corresponding icon in the Actions column.
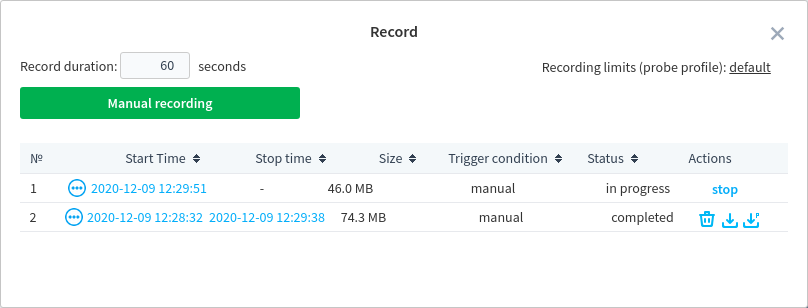
The Record window also displays the following information: recording start and stop times, records size and its status, trigger condition.
The Status column may display the following recording states:
in progress — the stream is currently being recorded;
completed — the probe has completed recording;
- aborted — the probe failed to complete recording. The following error codes are possible:
100 — an unknown reason;
101 — the task has been stopped;
102 — insufficient disk space;
103 — recording is prohibited for this source type;
104 — the task crashed, recording was stopped;
105 — the probe crashed, the recording was stopped;
110 - 119 — the server initiates recording stopping.
blocked — the record is currently downloaded and cannot be deleted.
The Actions column contains three tools to manage records:
 — download a Pcap record (only for IPTV broadcasting, UDP/RTP protocols);
 — download a conventional record (its type depends on a stream protocol);
 — delete a record.
Some system limits affect the recording process. To set the limits, click the probe profile name in the top right corner. The pre-buffering and recording duration settings are not applied to manual recording.
Pcap Recording
The Pcap recording provides the opportunity to analyse the IPTV streams delivery. In case the probe fails to analyse a stream, Pcap recording will capture an exact copy of network traffic for subsequent analysis. The probe captures network packets and records it to a file in the real-time mode. Pcap data are recorded both for automatic and manual recording. Once the recording is finished, you may download the record file. The record file includes a detailed description of a triggered event (in the JSON format) and a Pcap dump file which contains all network protocol headers used for a stream delivery as well as timestamps of captured data. You may open Pcap files in Wireshark or similar software designed for monitoring and analysing the network traffic which compatible with libpcap format.
When starting to work with Pcap records, you need to know the following important things:
Pcap recording is supported for only IPTV streams (UDP/RTP protocols);
Pcap records downloading is disabled by default due to security reasons (the probe may create Pcap records, but they cannot be downloaded from the browser). To allow records downloading, stop the probe or the service and open the probe configuration file, then set
truevalue for the"allowDownloadPcapDump"parameter. Save changes and start the probe;You need to run the probe with advanced privileges. For Windows: install the NPcap library and run the probe with administrator rights. For Linux, the probe should be started with root privileges
sudo ./streamMonitorcommand.
To download Pcap data, use the action.
Automatic Recording
Description
The automatic recording system starts to record a stream when a preconfigured trigger fires. This system is similar to the notification system in triggers set and its organization. For that reason, the recording journal is located among notification journals.
Automatic recording is available for both analysed stream types: IPTV and OTT.
Automatic recording can be enabled for several probe tasks as well for several probes within a project.
The probe uses pre-buffering in the HDD or RAM that guarantees that a record file will include a triggered event. Pre-buffering duration setting can be configured by a user.
In case the error state is lasting for a long period of time, the record file is divided into several parts, thus the archive contains the beginning and ending of a state.
For IPTV streams, both Pcap and MPEG-TS records can be downloaded.
Several tasks (including those of other probes within a project) can be synchronized to perform the simultaneous recording.
Configuration and Start
To configure automatic recording, you need to:
Check and change the probe system profile settings (if required);
Configure the automatic recording profile: set triggers, configure their thresholds and specify the recording duration settings;
Assign the profile to required tasks.
Adjusting System Profile
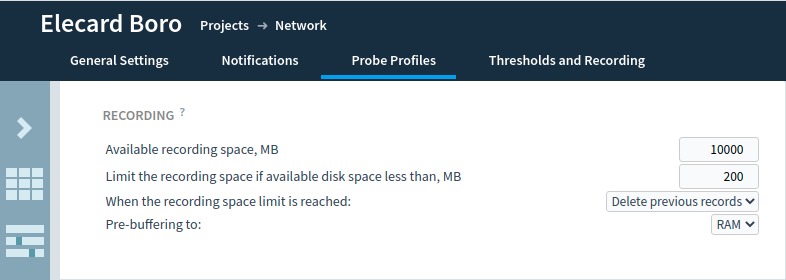
Go to the project settings and open the Probe Profiles tab. The Recording tab contains the following settings:
Attention
The System resources section of the probe page contains information about used and total space of the hard disk partition containing the record folder. If the probe cannot find or create the record folder, the size of the partition containing the probe folder will be displayed.
Available recording space — specifies the disk space available for storing records. When the limit is reached, either older records will be removed or new data recording will be paused depending on the user’s choice. The default value is 10000 Mb.
Limit the recording space if available disk space less than — specifies the minimal disk space threshold upon reaching which either older records will be deleted or new data recording will be paused. The default value is 200 Mb.
When the recording space limit is reached — specifies the probe behaviour when there is no available space left for new records: stop recording or delete previous records (by default).
Pre-buffering to - specifies the buffer location: the RAM or HDD. With a sufficient amount of RAM, it is recommended to use pre-buffering in RAM in order not to create excessive load on a relatively slow HDD system.
Once the configuration is completed, save changes.
Configuring Recording Profile
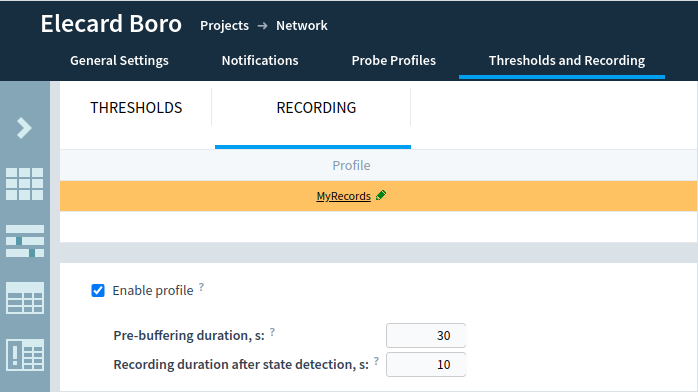
Go to Thresholds and Recording ➝ Recording. Create a new profile and set the “Enable profile” checkbox.
You can set the following recording parameters:
Pre-buffering duration — the size of buffer in the HDD or RAM in seconds. When a selected trigger fires, the buffer content is saved and a stream recording is performed. Thus, a record archive will include both data recorded during the pre-buffering period and data recorded after a trigger firing. The pre-buffering setting does not take effect for manual recording.
Recording duration after state detection — time during which a stream is recorded after a trigger firing. The setting does not take effect for triggers of the “Event” type, for which the total recording duration is equal to the double pre-buffering duration. To know more, go to the Recording duration section.
Next, set and configure required triggers that should initiate recording and save changes. Trigger configuration corresponds to the notification system triggers. If required, you may create an additional profile for different recording cases.
Recording Duration
The duration of the recording is determined by a combination of several factors. During automatic recording, pre-buffering is used to ensure that the beginning of the error state is always present in the record file. In addition, the recording process continues for some time after the end of the event what allows to investigate the transient processes in the stream.
The graph illustrates three types of recording depending on the duration of the state and the trigger type:
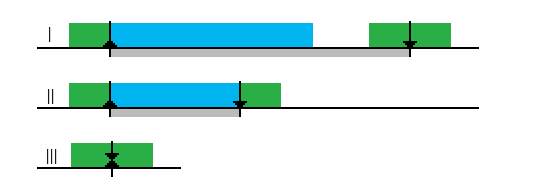
The duration of the event is longer than the set recording duration. In this case, the recording is fragmented that helps to save space on the hard disk. In the first fragment of the recording (the beginning of the state), the pre-buffering and the recording duration set by the user are saved. The second fragment (end of state) contains a stream part equal to double pre-buffering duration. Thus, it is possible to track both the moment of occurrence of the state and the moment of its termination with the subsequent stream restoring.
The duration of the event is shorter than the set recording duration. In this case, the stream is recorded without any record fragmentations. The record duration is the sum of event duration and double pre-buffering duration.
The probe registered firing the trigger of the “Event” type. In this case, the record duration is equal to double pre-buffering duration.
Classification of triggers into “State” and “Events” is described in the Triggers chapter.
Applying Recording Profile to an Analysis Task
Open the Configuration window of a run task.
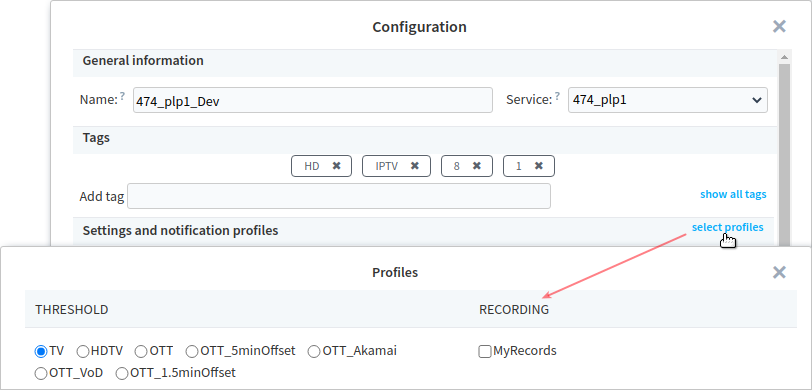
The Settings and notification profiles section contains information about all profiles assigned to a task. Use the select profiles action to assign a recording profile to a task. When you click the “OK” button, the changes will be saved and the profile will be applied to the task. The probe will start recording after the set trigger is fired. Several recording profiles can be assigned to one task. The recording profile is assigned to a new task in the same manner.
Simultaneous Recording
Simultaneous recording allows detecting the stage at which a stream issue occurs.
When configured, if a trigger fires, the probe starts recording for all synchronized tasks.
For example, the automatic recording can be started both on the transcoder’s input and output by firing of a preconfigured trigger.
Synchronized task records are marked with the  action icon.
To synchronize tasks: assign the same recording profile to several tasks, specify for these tasks the same value in the Name or Service fields.
Configuring Profile for Simultaneous Recording
Open the Thresholds and Recording tab, go to Recording and select a required recording profile. Set the “Enable synchronous recording by” checkbox. In the drop-down list, select whether tasks can be synchronized by the Name or Service field. Select required triggers that should initiate recording and save changes.
Starting Synchronized Tasks
To synchronize several tasks, specify the same Name or Service for them corresponding to the synchronization type selected in the recording profile. Next, assign the same recording profile to the tasks. After saving the changes, when the trigger fires, recording will start for all synchronized tasks.
Note
You may configure simultaneous recording for tasks of the same probe as well as tasks of different probes within the same project.
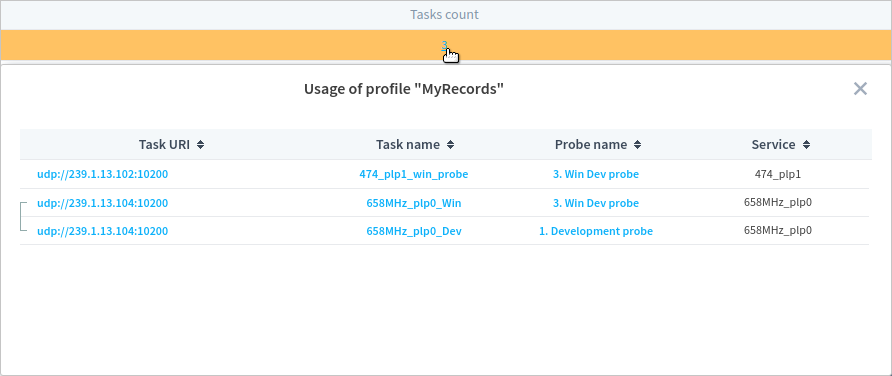
To verify that the tasks are successfully synchronized, return to the Recording Profile configuration page (Thresholds and Recording ➝ Recording). Profile usage statistics are displayed in the Tasks count column. By clicking on the number of tasks, the “Usage of profile” window will open which contains information about the URIs and names of tasks, probes and services. Synchronized tasks are graphically grouped together. To go to a certain task or probe, just click on it.
Journals and Lists
Recording Journals
The information about fired triggers that initiated recording is presented in the Record tab of the Notification and Record Journals page.
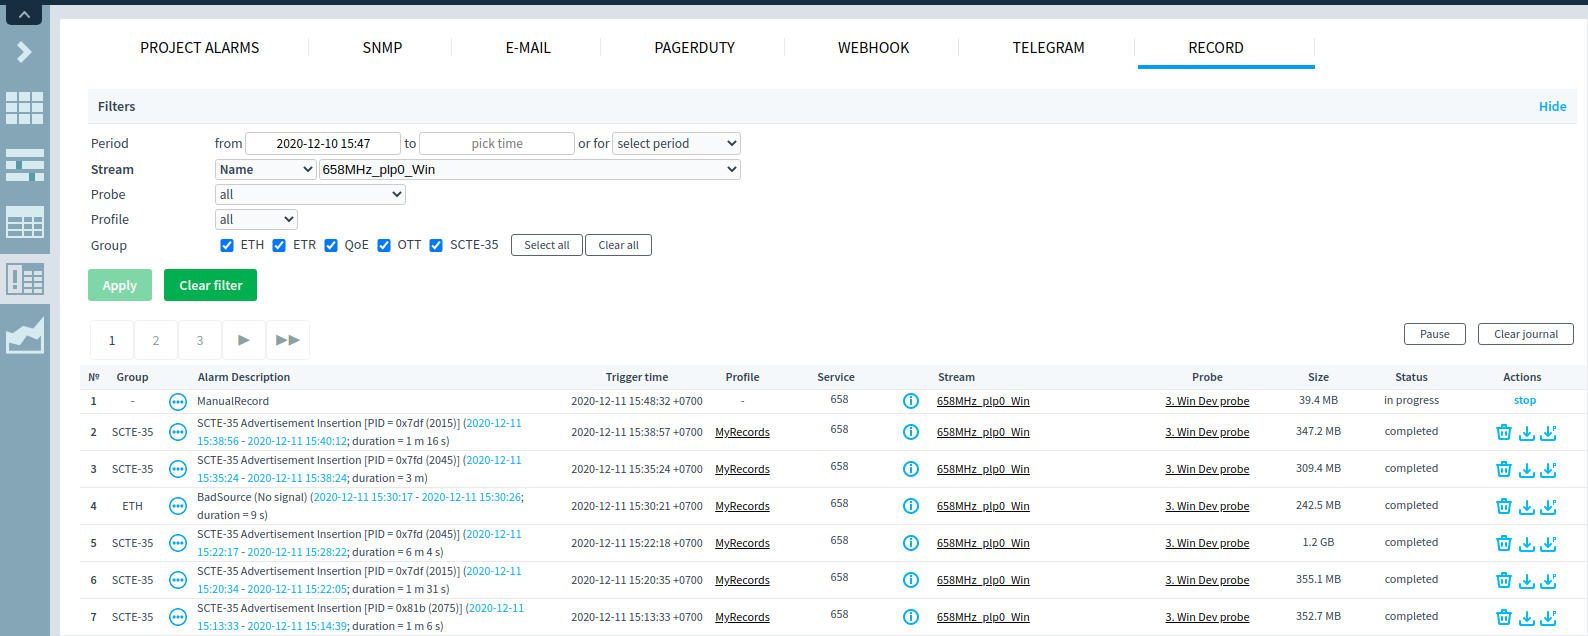
On the page, the following operating elements are available:
Filter — filters section which provides the functionality for flexible searching of needed records. For the Stream field, the search query can be manually specified (search by partial occurrence) or the user may select the option from the drop-down list (search by exact match, multiple strings search). Please note that filter settings remain the same after the page refreshing. In case all records should be displayed, click the Clear filter button.
Pause — the button stops a journal’s update until the user resumes updating.
Clear journal — clears the journal content after user’s choice confirmation. In the confirmation window, you may also enable deleting of all records for all active probes.
In the Journal section, all the fired triggers are enlisted. The Alarm Description column contains information about a trigger name that initiated recording. In case the user has manually recorded a stream, the Manual Record description is displayed. When clicking the date in the Alarm Description, you will go to a task page with positioning to this period on graphs. Each journal record is related to the probe physical record.
The Journal section contains the following tools:
 — details of a triggered event. The window displays information for reasons of a triggered event firing and additional information about a record;
 — service/stream details. The window displays tabs containing a stream PSI table, task and probe information, a manifest;
stop — action allowing forcibly stop recording;
- — download a Pcap record (only for IPTV broadcasting, UDP/RTP protocols);
- — download a conventional record (its type depends on a stream protocol);
- — delete a record;
- — viewing the window for synchronized tasks records.
When a trigger fires for synchronized tasks, several simultaneous recordings are initiated. The records of synchronized tasks window displays a list of initiated simultaneous recordings:
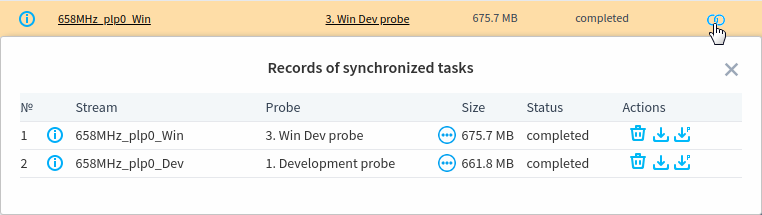
A stream that initiated recording is highlighted in bold.
To check records of a certain task, go to a task page and scroll it down to the TASK RECORDS tab.
Note
Journal data is kept for 14 days, then old journal entries are automatically cleared. However, probe records are not deleted (if there is available space on the hard disk) and can be downloaded through the list of records on the probe or task page.
Recording Lists
To view physical records of the probe, go to the probe page and in the “Record list” line click the show action.
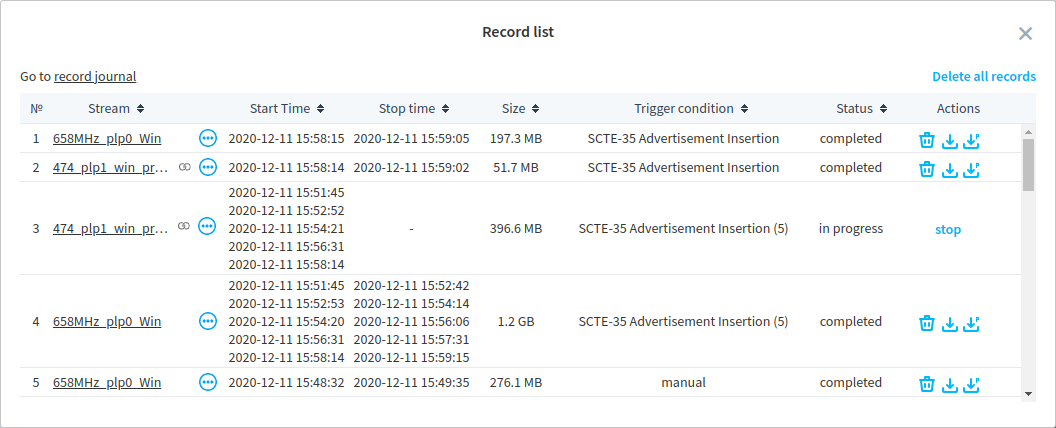
The list contains records for all the probe tasks, including those records that are created manually. The records are stored in the records folder until there is enough space on the disk. In case if there is no available space, the probe will pause recording or will remove old records in order to keep recording new data.
- — the Record Details window displaying information about an event beginning and end times, record details, and the list of synchronized tasks.
stop — action allowing forcibly stop recording.
- — download a Pcap record (only for IPTV broadcasting, UDP/RTP protocols);
- — download a conventional record (its type depends on a stream protocol);
- — delete a record;
- — an icon indicating a simultaneous record. This sign denotes that a record was initiated by a synchronized task;
Delete all records — removing the all probe records. After confirming the deletion all physical records will be deleted from the probe (the records folder will be cleared).
For continuous states, a record is fragmented into two periods and information for each period is displayed in the Start time and End time columns. Moreover, in case the process of automatic recording is already running and the probe detects multiple trigger firing, several additional fragments are recorded. For example, the advertisement insertion trigger for a MPTS stream may fire several times within a short period for different programs. It’s guaranteed that record fragments include the beginning and end of each detected state. For the Trigger condition column, in the brackets, the amount of trigger firing follows a trigger name. For simultaneous recording, this number is the sum of all trigger firings for all synchronized tasks.
To view the list of records for a certain task, go to a task page. In the upper part of the page, click on the RECORD action.