
2.3. Choosing Ethernet Controller
General Information
Network Interface Controller (NIC) is an important part of the monitoring system, its internal architecture determines the system performance and precise calculation.
Note
Ethernet parameters (IAT, DF and MLR) are calculated based on Ethernet packets capturing and marking. This process is performed at hardware and software levels.
This chapter contains a table with individual peculiarities applied to some controllers, that can help a user to select a proper controller. To select a proper controller, a user should understand and consider information below:
Network adapter
View Network Adapter Details
Linux
To define what controller/adapter is installed in the system, use the following commands. All the methods require the corresponding utilities to be installed.
sudo lshw -class network— view all interfaces connected to the system: adapter’s name, description, performance, speed, driver, etc.;lspci | grep -i 'net'— product and NIC manufacturer’s name;sudo ethtool eth0— information about adapter eth0 (specify your adapter): settings, connection status, speed, etc.;sudo ethtool -i eth0— driver information.
Windows
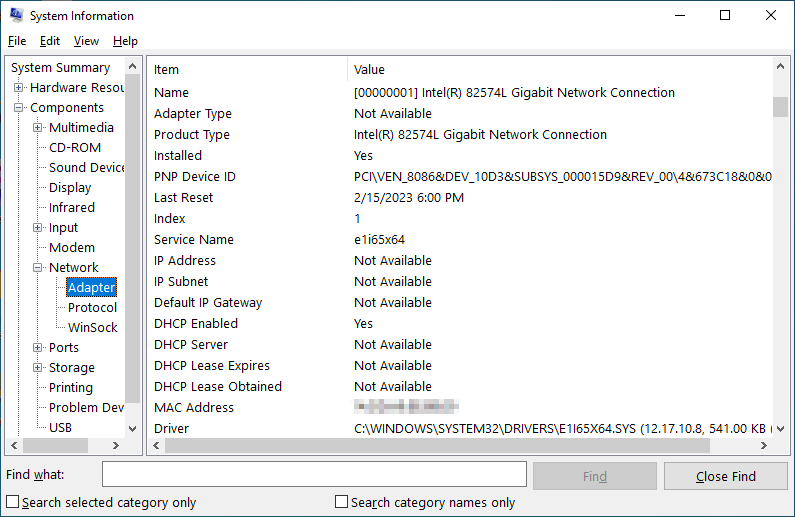
One of the easiest ways to view network adapter details in Windows 10 and Windows 11 is to use the System Information tool:
Open the Start menu and type
msinfo32or “system information”. Select System Information from the results. This will open the system information tool. Please note that it may take a few moments before the actual data is displayed on the window.Go to “Components ➝ Network ➝ Adapter”.
You can scroll through the list of adapters in the pane on the right.
See also
The original article with other view options is available at How to View Network Adapter Details in Windows.
Controller Features Summary
Feature/network adapter |
Intel 82575 |
|||||||
|---|---|---|---|---|---|---|---|---|
HW timestamping |
Per-packet |
Per-packet |
Per-packet |
Per-packet |
✔ |
✖ 1 |
✔ |
✖ |
Rx queue # (RSS) per port |
Up to 8 |
2 |
Up to 2 |
Up to 4 |
Windows: 2
Linux 2: 1
|
Up to 16 |
4 |
4RX + 4TX |
Feature/network adapter |
|||||
|---|---|---|---|---|---|
HW timestamping |
✖ |
✖ |
|||
Rx queue # (RSS) per port |
30 combined |
64 combined |
Timestamping of Ethernet Packets Receipt
The technology and recommendations
This section describes factors affecting precision of IAT and DF calculation.
While packets are captured, each packet is timestamped. These timestamps can be set by a software or by hardware. See more details on timestamps calculation performed by the operating system at the tcpdump utility website, section PCAP-TSTAMP. Hardware timestamping decreases general load of the host, increases calculation precision and eliminates dependency of timestamping from the host load. Software timestamping is less precise and depends on the CPU load: in case of CPU high utilization, calculation precision is negatively affected.
In its turn, the hardware timestamping can be implemented in multiple ways. Per-packet timestamping (Intel terminology) is considered to be the most effective. A probe automatically uses hardware timestamping if it is available.
Investigations carried out by Elecard showed that divergence for Maximum and Average IAT calculated under medium CPU load with software timestamping and with hardware Per-packet timestamping is 10-15%. However, divergence in calculation results for Minimum IAT can be -100%…+10000% of expected values with software and hardware timestamping (if other than the Per-packet timestamp mode is used). Timestamping peculiarities exert influence on the calculation results.
Conclusion
Jitter is characterized by the Maximum IAT parameter that is precisely calculated with software mode but only under medium CPU load. Low-cost adapters support only software mode and can be recommended only for system testing. However, for full-featured and permanent operation the adapter supporting hardware timestamping is recommended. It is recommended to use NIC supporting Per-packet timestamping to precisely calculate all parameters (including Minimum IAT).
Note
Hardware timestamping is supported by Linux OS only.
Does my adapter support hardware timestamping?
There are some ways to find out if a network adapter has hardware timestamping support:
Linux — tcpdump
Tcpdump utility. Use this utility to see the list of timestamping modes:
tcpdump -J -i <INTERFACE_NAME>
Example of the command execution:
[root@localhost ~]# tcpdump -J -i enp2s0
Time stamp types for enp2s0 (use option -j to set):
host (Host)
adapter (Adapter)
adapter_unsynced (Adapter, not synced with system time)
The modes with timestamps set by network adapter are highlighted. If hardware support is available, the probe will use it automatically.
See also
Read the article MAN PAGE OF PCAP-TSTAMP.
Linux — Probe log
Probe log. When starting the probe, you can see information on packet capture devices in a log:
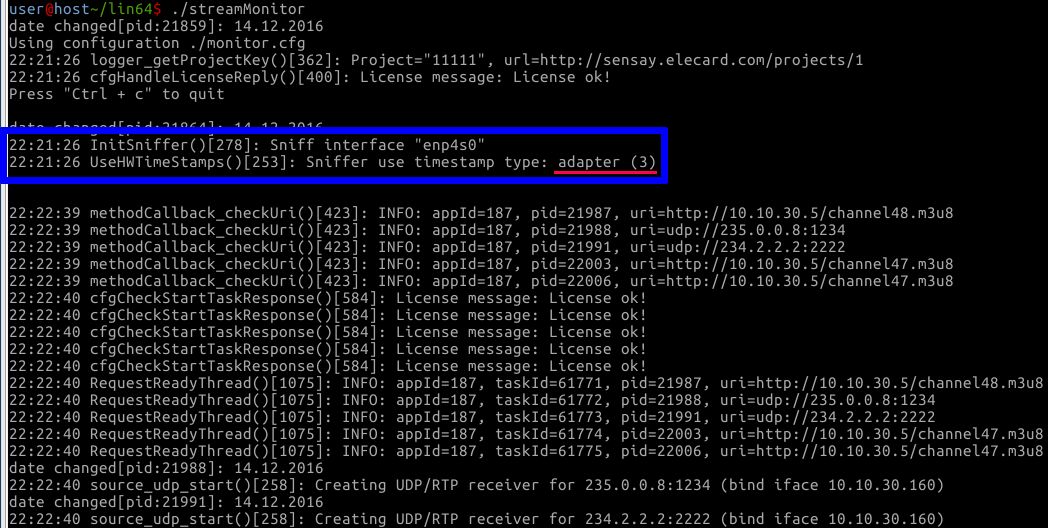
Sniffer use timestamp type: adapter (3)
Sniffer use timestamp type: adapter_unsynced (4)
Linux — ethtool
Ethtool utility in the Linux OS.
ethtool -T <INTERFACE_NAME>
In the command result, there should be Capabilities: hardware-receive and Hardware Receive Filter Modes: all. Example of the command execution:
[root@localhost ~]# ethtool -T eno1
Time stamping parameters for eno1:
Capabilities:
   hardware-transmit     (SOF_TIMESTAMPING_TX_HARDWARE)
   software-transmit     (SOF_TIMESTAMPING_TX_SOFTWARE)
   hardware-receive      (SOF_TIMESTAMPING_RX_HARDWARE)
   software-receive      (SOF_TIMESTAMPING_RX_SOFTWARE)
   software-system-clock (SOF_TIMESTAMPING_SOFTWARE)
   hardware-raw-clock    (SOF_TIMESTAMPING_RAW_HARDWARE)
PTP Hardware Clock: 0
Hardware Transmit Timestamp Modes:
   off                   (HWTSTAMP_TX_OFF)
   on                    (HWTSTAMP_TX_ON)
Hardware Receive Filter Modes:
   none                  (HWTSTAMP_FILTER_NONE)
   all                   (HWTSTAMP_FILTER_ALL)
Receive-Side Scaling
The technology and recommendations
This section describes factors affecting MLR detection and general performance of the system.
Receive-Side Scaling (RSS) is one more important peculiar feature supported by a network controller (link 1 , link 2).
The essence of the RSS technology is quite simple — network layer input data stream is divided into several queues, and each queue is handled (calling interruptions, data copying) by a particular virtual processor (i.e., either by a physical CPU or by a core). Correspondingly, in case of several processors it is possible to distribute high-volume network traffic handling among them and to decrease the number of interruption calls, context switches, cash flushes and other issues which affect the system performance in general.
The above-mentioned is fair, when interruptions are distributed between several cores of the single processor host, interrupt service load is distributed, and the core is not overloaded.
In fact, a low-cost NIC that does not have the RSS technology starts losing data (registering false MLR and CC errors) at a particular bitrate. The whole interrupt service load of a controller is born by the only core that is 100% loaded, though other cores are unloaded. The value of maximum possible bitrate depends on the CPU and system performance in general.
However, the RSS technology supported by a network controller does not mean that the OS utilizes several cores for interrupt service. To set automatic distribution of interrupt handling between cores in Linux OS, install and run the package irqbalance that provides interrupt load balancing between different cores. See more details on load balancing in the section Am I using NIC Interrupt Balancing?
Please note that some of Intel adapters use the e1000e driver that does not support RSS (even if RSS support is mentioned in the controller documentation) in Linux OS.
It is impossible to provide unambiguous recommendations at what bitrate it is required to use RSS cards, because different systems show different investigation results. If the CPU core is overloaded when the Ethernet parameters calculation is disabled (Ethernet parameters calculation can show similar unbalanced load of one or more cores), it is recommended to use controllers supporting RSS.
Conclusion
It is recommended to use NIC supporting Receive-Side Scaling.
Am I using NIC Interrupt Balancing?
Linux
As it is mentioned in the article Receive-Side Scaling (RSS), to check whether interface interrupts are distributed between several cores, execute the following command:
egrep 'CPU|<INTERFACE_NAME>' /proc/interrupts
The possible replies are given below:
Reply is returned as the set of several strings
         CPU0    CPU1    CPU2    CPU3    CPU4    CPU5
89:   40187       0       0       0       0       0   MSI-edge   p1p1-0
90:       0     790       0       0       0       0   MSI-edge   p1p1-1
91:       0       0     959       0       0       0   MSI-edge   p1p1-2
92:       0       0       0    3310       0       0   MSI-edge   p1p1-3
93:       0       0       0       0     622       0   MSI-edge   p1p1-4
94:       0       0       0       0       0    2475   MSI-edge   p1p1-5
The reply shows that the driver creates six queues. The number of interrupts handled by each core and the interrupts distribution between cores are stated in the reply received.
Only one string in the reply
         CPU0       CPU1
27:     108    1595151   PCI-MSI-edge      enp2s0
The reply shows that only one queue is used. It may be caused one of the following reasons — adapter does not support several queues or interrupt balancing is not set.
To check if irqbalance (included in a standard build) is started on CentOS 7 / Rocky Linux 8, execute the following command:
systemctl -l status irqbalance.service
If the phrase “Active: active (running)” is included in the reply, daemon is running. More detailed information about irqbalance is described in RedHat official documentation.