
1.2. GUI and Data Layout Description
During monitoring, Elecard Boro registers a lot of parameters based on which you can make a conclusion about quality of a stream sent via the network. For easier data perception, there are several data layouts in the system:
Live data / data for the past period;
Thumbnails / graphs / tables with numerical data;
General characteristics for the bunch of streams / Detailed parameters of specific tasks, etc.
On the left panel there is a set of icons (buttons) and each of them enables data layout in a predefined way.
Icon |
Layout Name |
Data displayed |
Number of monitored streams |
|---|---|---|---|
|
Provides real-time block representation of all analyzed services. A card color corresponds to the alarm severity level. |
All / Consolidated streams |
|
|
Displays stream thumbnails as a mosaic with error flags indicating active triggers and availability trend. Frequency of thumbnails update depends on settings of a particular task. |
All / Consolidated streams |
|
|
Displays streams as real-time dynamic stripes indicating registered issues or events. Updates each second. |
All |
|
|
Displays real-time quantitative characteristics of streams in a table form. Includes IPTV and OTT tabs. |
All |
|
|
Common (for all tasks) journal of registered alarms events and journals for different notification profiles (SNMP, E-Mail, PagerDuty, Webhook, Telegram) + Records journal. |
All |
|
|
Displays graphical representation of MulticastRate and IAT:MLR/DF:MLR on a short interval (20s) + basic QoS parameters for IPTV streams represented in the table form. |
All |
|
|
Displays in the table form statistics of errors for all analyzed streams and provides the tool for scheduling recurring reports about the service quality. |
All |


Working With Views
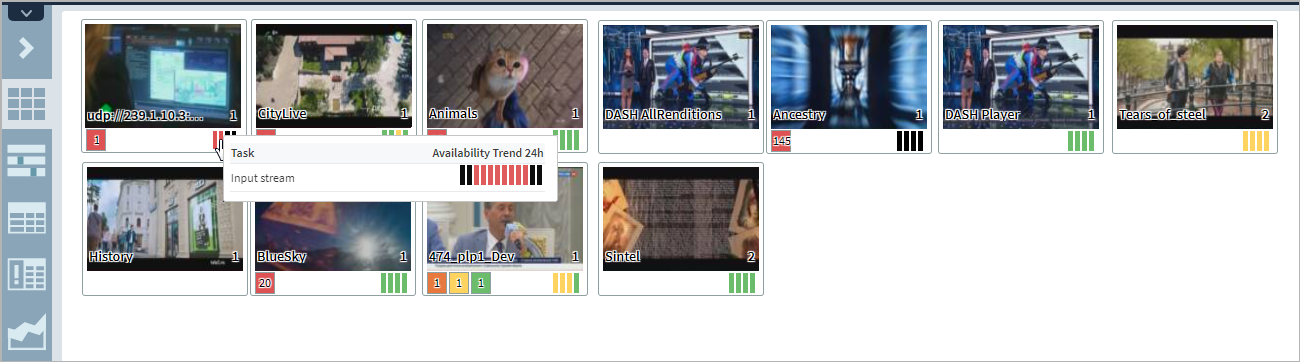
MosaicView
The view is designed for displaying channel thumbnails. Additionally, it provides the possibility of tasks consolidation. A displayed thumbnail is randomly selected from the streams group. IPTV tasks take priority. Upon clicking a thumbnail, a window with detailed information opens. If the alarm trigger fires for a task, an error state is displayed as a colored card. The color of a card corresponds to the severity level of a fired trigger. If a task has the enabled KPI availability profile, a KPI graph for the 8-hour monitoring period will be displayed. When grouping several tasks, there will be a graph for a task with the most critical state. When hovering a graph, a popup window with 24-hour availability graph will appear. To go to the full statistics, click the graph within a popup window.
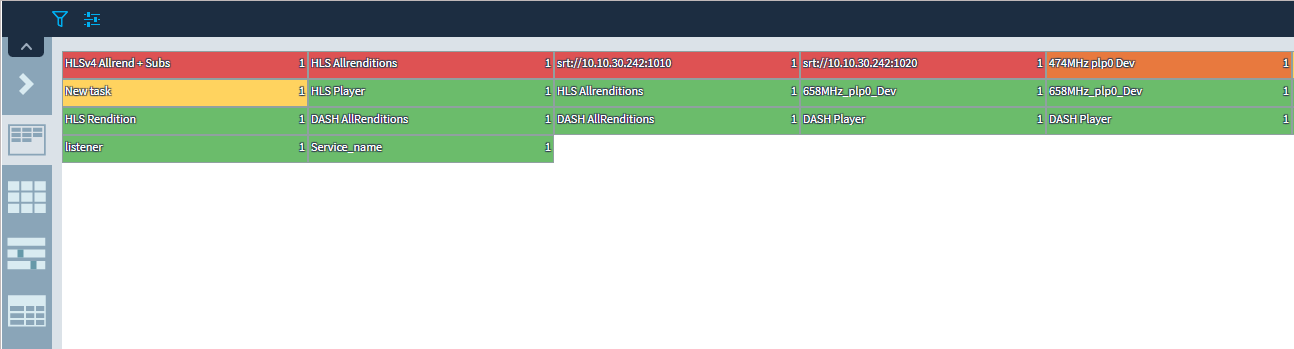
BlockView
The BlockView is designed to compactly display all analyzed services. With the smallest scale possible, the view may display up to 1000 tasks on the screen with 1920x1080 resolution. Some fixed view scales are available. Like MosaicView, it provides task consolidation. The mode of ranging blocks in accordance with errors severity level is implemented.
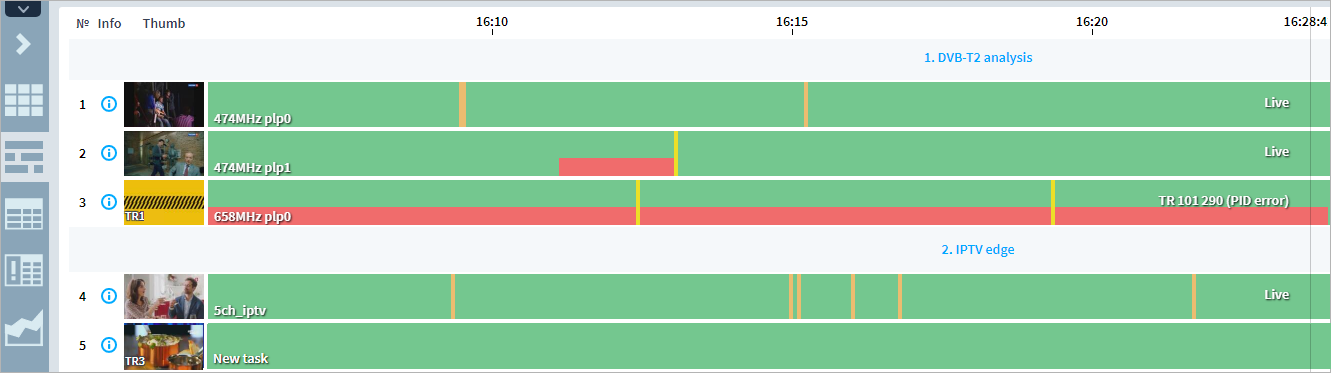
LiveView
Attention
The current LiveView implementation is aimed only at displaying mentioned events and states while the system can register significantly more events. It is recommended to configure a notification system and use notifications and Alarm journal monitoring together with any of views.
On the page, a list of streams is displayed. Each stream is shown as a horizontal stripe. The larger the browser window resolution, the longer the time interval will be displayed on the graph. When hovering a mouse, the hint with the description of a stream state at the chosen moment is displayed. When clicking a stripe, a page of the analyzed task opens.
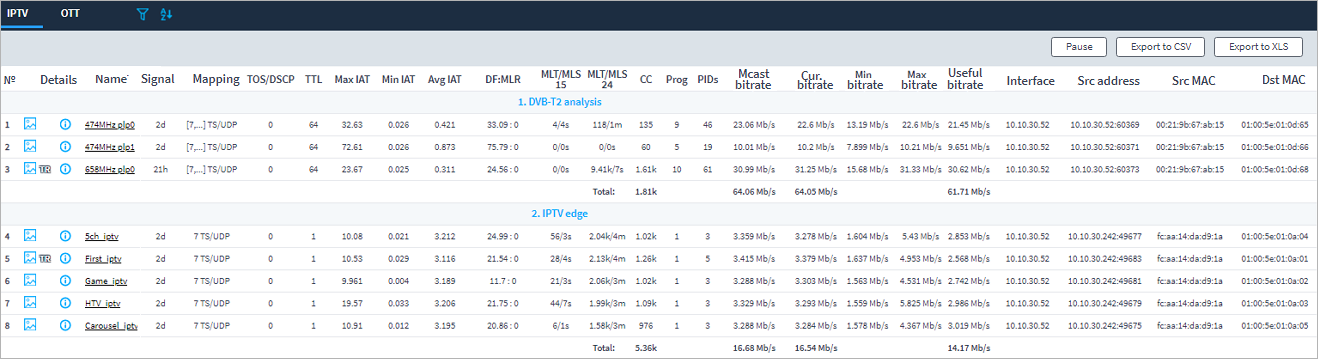
TableView
In this section, all statistical information is grouped into a table that allows to perform comparative analysis of QoS and QoE parameters for IPTV or OTT streams. The IPTV tab displays the extended set of Ethernet parameters, which is available within this view only. For a stream bitrate, maximum and minimum values are additionally registered what allows to estimate the range of values. If you select the option of grouping tasks by probe, the total statistics for bitrate and CC errors is available. If needed, the table can be exported to the XLS format.
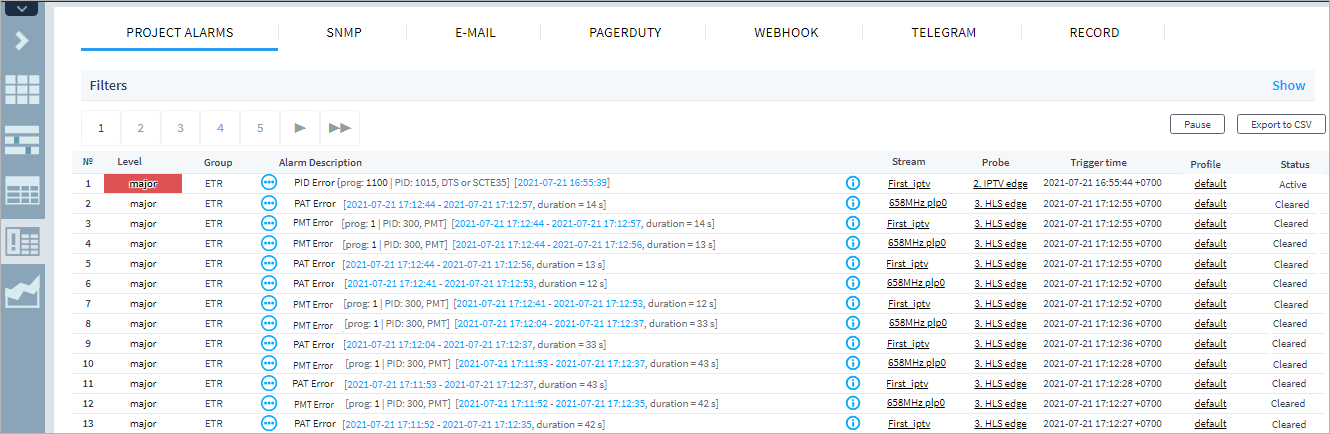
Journals
On the Journal page, there is a list of alarm events registered by the system in the real-time mode. New events dynamically replace previous records, thus making the page scrollable. Active states are displayed at the top lines of a table with colored indicators of their severity level. When registering several events of the same type within the same stream, they are grouped into one record. Along with Alarm events, other notification types and records are registered in corresponding journal tabs.
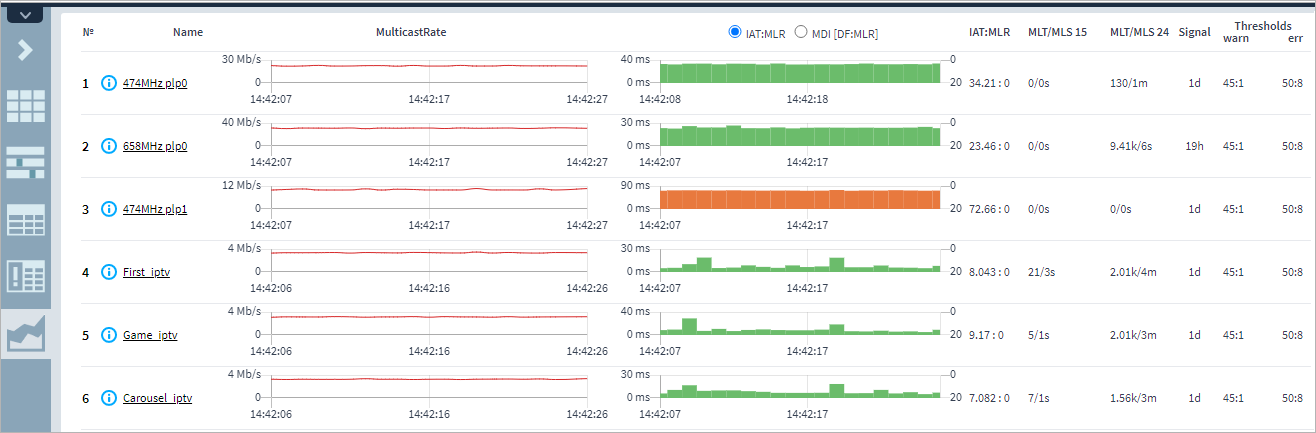
GraphView
The Graph View is designed to provide the visual monitoring of basic QoS parameters for IPTV streams. The compact view of presented information and advanced filtering via tags allows performing comparative analysis of some streams, e.g. analysis of the same stream at the input and output of a headend.
KpiView
KpiView is designed to display statistics of errors for all analyzed streams and to schedule recurring reports about the service quality.
To start collecting KPI statistics, the Availability profile should be set to a task. To read detailed information, go to KpiView section.
The Health tab represents a real-time report about the quality of analyzed streams in the table form. The statistics contains the following key metrics: Losses, Service Availability, BadSource, Alarms firing statistics, Active Alarms. Statistics is displayed for the last 24 hours and for the last 15 minutes. The view allows for quick health estimation of each service without switching to other views or journals, it also presents the Service Availability trend.
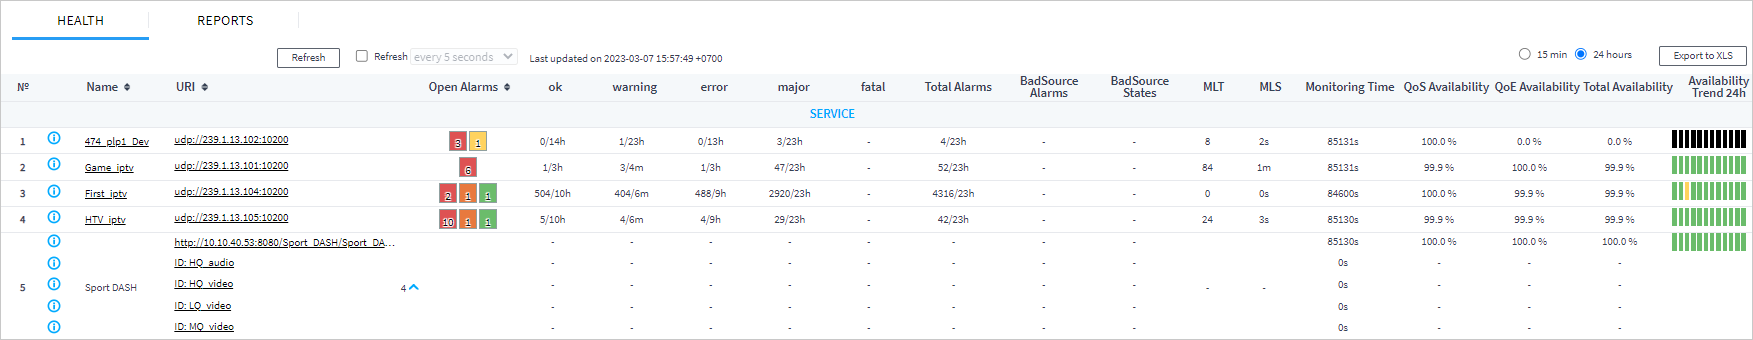
Service Availability is a new parameter the Boro system registers. It is calculated as a percentage ratio of error-free monitoring time to total monitoring time. The metrics is based on the SCTE 168-6 standard. To register errors, the “error second” term is used, which denotes a second within which at least one error has occurred. Triggers affecting the Service Availability are included in the separate profile. The user by himself chooses a set of triggers within a profile that the system will register.
The mini-graph of availability trend represents changing of the service total availability for last 24 monitoring hours. One division equals to 2 hours. The division color corresponds to the color map of Service Availability levels set in the KPI ➝ Service Availability section. When clicking the mini-graph, the window with statistics for each 15 minutes opens.
The Reports tab allows for scheduling recurring reports about the service quality. The report may include all parameters available on the Health tab. Report can be one-time (for the user-selected period) or recurring for the previous day or week.