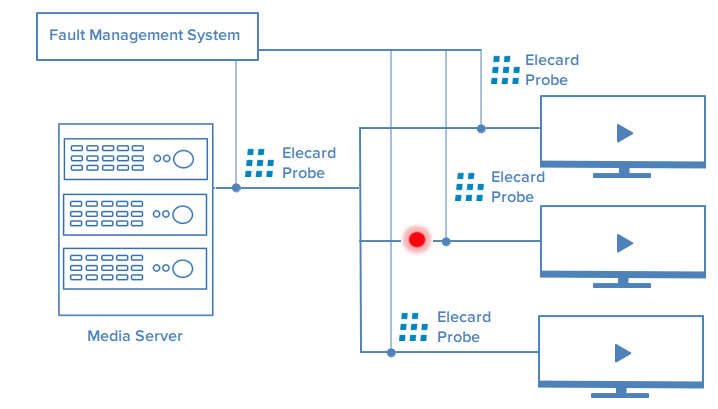
1.1. System Description

Features of Elecard Boro
Projects
Creating projects and organizing project sharing
Starting several probes in one project
Changing a project owner to another registered user
Distributed project access system (roles Viewer, Administrator, Operator, Engineer)
Setting a default view
Tasks
Individual configuration of parameters to monitor for each task
Manage and restart tasks
Check statistics on each task: detailed display of all parameters and metrics for each video stream, video thumbnails, CPU/RAM utilization for each task
Consolidation of multiple tasks using a common value for the Service fields
Key Features
Monitoring of UDP, RTP, HTTP, SRT, NDI*, RTMP (Pull), HLS, and DASH streams
Measurement of QoS and QoE parameters
Checking for stream conformity to the TR 101 290 standard
Counting the quantity and duration for errors of each priority (fired triggers)
Calculating Service Availability and sending recurring reports on the quality of service by e-mail
Ad insertion control in transport streams and playlists using SCTE-35
Analysis of OTT services in AllRenditions/Player modes for monitoring all mediadata or a variant stream with the best quality that can be allowed by the network bandwidth
OTT custom tag detection
Setting OTT analysis offset
Logging of system events and user actions
Logging of performed records and notifications (Project Alarms, SNMP, E-Mail, PagerDuty, Webhook, Telegram)
Export of Journals, Reports and Tables in the CSV or XLS format;
Detection of ECM, EMM tables
Parsing and display of the following TS stream tables: SDT, BAT and NIT
Display of HDR headers in the Video information window. All basic HDR formats are supported
Probes
Setting and configuration of tasks for each probe
Saving/applying/sharing probe configurations
Check probe resources (RAM/CPU/HDD/Network)
Probe update history
Logging of recordings and notifications
Capturing mirrored packets (Sniffer)
Recording for SRT, IPTV, OTT, and RTMP streams by each trigger
Pcap recording for IPTV streaming (UDP/RTP protocols)
Simultaneous recording in several synchronized tasks
Download records from remote probes to the user’s browser using WebRTC technology
Ability to use the ffmpeg decoder
Ability to upgrade a probe to a developer version
Data Visualization
Viewing list of projects and probes
LiveView for streams monitoring in real-time mode
BlockView and MosaicView to check the whole network on 1 screen
Penalty area for BlockView and MosaicView where streams are held while alarms are triggered
Filtering tasks by tags in different views
TableView to monitor all stream metrics and parameters in the real time mode
Display of streams state summary (input stream bit rates, PID bit rate, etc.) in graphic form
Displaying the summary of fired triggers for all OTT service subtasks on the Manifest page (Service Alarms tab)
Project statistics panel (number of active probes/tasks, number of tasks in the BadSource (No signal) state, active alarms, MLT/MLS 15, service availability 15 minutes)
Positioning graphs to the event registration time
Synchronization of LiveView with other tabs (the TabSync© technology)
Graphs scaling on a task page
KpiView to display statistics of errors for all analyzed streams and to schedule recurring reports about the service quality
Interface light and dark themes
Notification System
Registering project events in Alarm Journal
Sending notifications to email and to external systems (SNMP, Webhook, Pagerduty, Telegram)
Sound notifications for registered events
Individual configuration of notification profiles
Applying notification profiles to each task automatically by user defined rules
Create several notification profiles for each notification type
Integration
Akamai CDN support
Full support of the SAML authentication
[Boro Solution] The Control API is meant for the Boro Solution management and receiving analysis results
[Boro Solution] Integration with the Dataminer network control platform. The interaction between two solutions relies on a connector (protocol) that is developed specifically for Dataminer software