Probe System Profile
System notifications
Name |
Description |
Default value |
|---|---|---|
CPU Usage Warning Threshold, % |
The percentage of the CPU load at which a probe sends the High CPU Usage Warning state.
|
70 |
CPU Usage Error Threshold, % |
The percentage of the CPU load at which a probe sends the High CPU Usage Error state.
|
90 |
RAM Usage Warning Threshold, % |
The percentage of the RAM utilization at which a probe sends the Out of Memory Warning state.
|
70 |
RAM Usage Error Threshold, % |
The percentage of the RAM utilization at which a probe sends the Out of Memory Error state.
|
90 |
RECORDING
Name |
Description |
Default value |
|---|---|---|
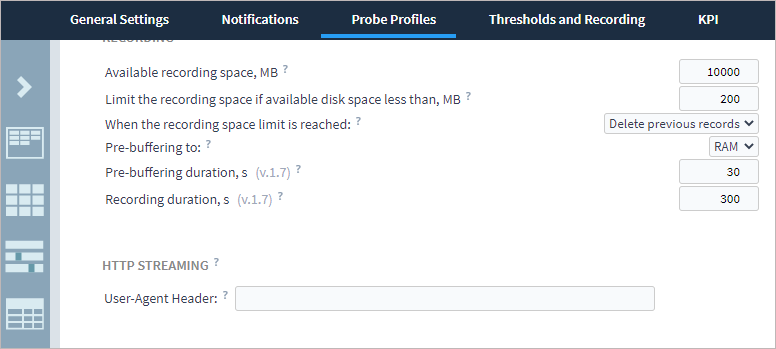
Available recording space, MB |
The amount of memory used for storing records, in megabytes. When the limit is reached, either older records will be removed or new data recording will be paused depending on the user’s choice.
|
10000 |
Limit the recording space if available disk space less than, MB |
Specifies the minimal disk space threshold (in megabytes) upon reaching which either older records will be deleted or new data recording will be paused.
|
200 |
When the recording space limit is reached: |
Specifies the probe behavior when there is no available space left for new records: stop recording or delete previous records.
|
Delete previous records |
Pre-buffering to: |
Specifies the buffer location: the RAM or HDD. With a sufficient amount of RAM, it is recommended to use pre-buffering in RAM in order not to create excessive load on a relatively slow HDD system.
|
RAM |
HTTP streaming
User-Agent is a part of HTTP request header that the server or a node uses for the identification of the client application. Usually an identification string contains name, application version, OS and language. The User-agent string starts with User-agent: or User-Agent:.
If the field is blank, “Boro client (<PLATFORM>) <VERSION>” is used as User-agent by default.
To create your own identification string, you need to edit the System profile or create a new probe profile. For this, open Project Settings ➝ Probe Profiles ➝ SYSTEM. Click the profile name or copy one of the existing profiles and edit the User-Agent string. Pay attention that each profile has a counter that displays the number of probes with such a profile.
Fill in the UserAgent field (the string length is up to 4kB) and click the Save button located at the bottom of the page.

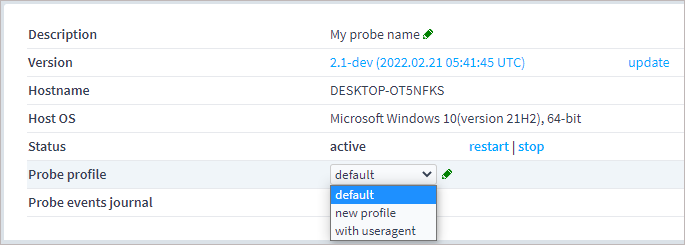
Go to the probe page (by clicking the probe name in the side flip). The probe should be active. Select from the list the required probe profile.

After applying the pre-set profile, the probe should send requests with the stated User-Agent.
ALARM
Name |
Description |
|---|---|
Out of Memory Warning |
Warning of exceeding the RAM threshold.
|
Out of Memory Error |
Error of exceeding the RAM critical threshold.
|
High CPU Usage Warning |
Warning of exceeding the CPU threshold.
|
High CPU Usage Error |
Error of exceeding the CPU critical threshold.
|
Server Lost Connection to Probe |
It triggers if the server does not receive data from a probe within 60 seconds. Afterwards, the connection with the probe is considered to be lost.
|
Probe Lost Connection to Server |
It triggers if connection from the probe to server cannot be established within the stated period.
|
Pcap Loading Error |
The Ethernet parameters are measured under the following conditions:
Windows: The Npcap (https://nmap.org/npcap/) packet capture library should be installed on the PC before a probe starts. While installing the library, WinPcap API-compatible Mode and Support Loopback Traffic options should be selected.
Linux: The probe should be launched with root privileges (sudo ./streamMonitor).
|
Record Access Error |
It triggers when the probe cannot access the ‘./record’ folder, its subfolders and content. Usually, the error occurs when the probe was initially started with superuser privileges and then was restarted with regular user permissions. To address the error, stop the probe and change owner/access permissions for the ‘./record’ folder and its content.
|
E-MAIL
Name |
Description |
|---|---|
Out of Memory Warning |
Warning of exceeding the RAM threshold.
|
Out of Memory Error |
Error of exceeding the RAM critical threshold.
|
High CPU Usage Warning |
Warning of exceeding the CPU threshold.
|
High CPU Usage Error |
Error of exceeding the CPU critical threshold.
|
Server Lost Connection to Probe |
It triggers if the server does not receive data from a probe within 60 seconds. Afterwards, the connection with the probe is considered to be lost.
|
Probe Lost Connection to Server |
It triggers if connection from the probe to server cannot be established within the stated period.
|
Pcap Loading Error |
The Ethernet parameters are measured under the following conditions:
Windows: The Npcap (https://nmap.org/npcap/) packet capture library should be installed on the PC before a probe starts. While installing the library, WinPcap API-compatible Mode and Support Loopback Traffic options should be selected.
Linux: The probe should be launched with root privileges (sudo ./streamMonitor).
|
Record Access Error |
It triggers when the probe cannot access the ‘./record’ folder, its subfolders and content. Usually, the error occurs when the probe was initially started with superuser privileges and then was restarted with regular user permissions. To address the error, stop the probe and change owner/access permissions for the ‘./record’ folder and its content.
|
Custom subject |
You can specify your own subject for e-mail notifications. If necessary, use the <Project>, <Probes> and <Tasks> macros, which will be replaced when the email is sent with the actual project name, probe name and list of tasks for which the alarm was triggered. The list of tasks is separated by commas; however, if there are more than three tasks, the subject will contain the phrase “and others” instead of listing the subsequent task names. The subject may include no more than 80 characters.
|
Send error notifications by e-mail: |
Selecting recipients for sending error notifications. |
SNMP
Name |
Description |
|---|---|
Out of Memory Warning |
Warning of exceeding the RAM threshold.
|
Out of Memory Error |
Error of exceeding the RAM critical threshold.
|
High CPU Usage Warning |
Warning of exceeding the CPU threshold.
|
High CPU Usage Error |
Error of exceeding the CPU critical threshold.
|
Server Lost Connection to Probe |
It triggers if the server does not receive data from a probe within 60 seconds. Afterwards, the connection with the probe is considered to be lost.
|
Probe Lost Connection to Server |
It triggers if connection from the probe to server cannot be established within the stated period.
|
Pcap Loading Error |
The Ethernet parameters are measured under the following conditions:
Windows: The Npcap (https://nmap.org/npcap/) packet capture library should be installed on the PC before a probe starts. While installing the library, WinPcap API-compatible Mode and Support Loopback Traffic options should be selected.
Linux: The probe should be launched with root privileges (sudo ./streamMonitor).
|
Record Access Error |
It triggers when the probe cannot access the ‘./record’ folder, its subfolders and content. Usually, the error occurs when the probe was initially started with superuser privileges and then was restarted with regular user permissions. To address the error, stop the probe and change owner/access permissions for the ‘./record’ folder and its content.
|
Send error notifications via SNMP |
Configuring SNMP notifications sending. |
Community string |
SNMP community string used for authentication. |
Trap destination IP address |
SNMP trap uses 162 port by default unless otherwise defined.
|