Elecard Boro - Quick Start Guide
{
  "last_commit": {
    "date": "2023-12-14 09:30:25 UTC",
    "hash": "7480a46",
    "describe": "2.0.1-46-g7480a46"
  },
  "build": {
    "date": "2023-12-14T09:30:41Z",
    "clean repo": true,
    "sphinx version": "sphinx-build 4.5.0",
    "machine": "runner-pfqn1bvn-project-32-concurrent-0"
  },
  "note": ""
}
1. Register your account and get the probe
For correct instructions, select the type of software you are using:
Boro Cloud Service
To register, fill in the fields marked with an asterisk, accept the terms of User License Agreement and agree to the terms of processing of your personal data. You will get a confirmation email with an activation link. Follow link in email, to confirm your registration.
Boro Solution
To register in Boro Solution, fill in all fields and click the Register button. If the email verification is enabled in settings of Elecard Boro Solution, you will receive the confirmation email. Click on the verification link to confirm the email. Then contact the Elecard Boro Solution administrator to activate your account.
Log in and click the Add Project button.
You will be redirected to the project page automatically. To download the probe’s archive file, click the Get Probe button.
Extract the downloaded archive to a required directory.
Note
The authkey.pub is added to archive when downloading the probe. This key binds the probe to the parent project.
2. Set up and run the probe
Attention
It is not recommended to run the probe under virtual machines. When analyzing IPTV streams: their recording and Ethernet parameters (IAT, MLR) may be unreliable. Due to the large number of solutions for virtualizing OS and network subsystems, the operation of the probe under VM is not tested and is not guaranteed.
Editing the probe configuration
Open monitor.cfg in a folder matching your operating system (lin64, win64). To configure the probe, you may edit the following parameters:
AppDescription - the probe name. When specifying the probe name, do not use the following characters:
"<>.proxy - the proxy server name. To enable parameter, delete
//commenting symbols at the beginning of the line.allowDownloadPcapDump - enables downloading Pcap records. This functionality is disabled by default due to security reasons (the probe may create Pcap records, but they cannot be downloaded from the browser). To allow records downloading, set the parameter value to
true.
Note
The file must be saved in the UTF-8 if you use non-alphanumeric symbols.
Running the probe
Important: to access the full functionality of the monitoring system when analyzing IPTV streams, a probe should be started with root privileges. Root privileges (Administrator rights in Windows) are required for following features:
Analyzing the following Ethernet parameters: IAT, MLR/DF, TOS/DSCP, TTL, Src/Dst MAC;
Recording IPTV streams in the Pcap format;
Capturing mirrored packets via sniffer;
Receiving the multicast packets on the ports lower than 1024 (only for Linux OS)
Follow the instructions below to run the probe depending on the type of your operating system:
Windows
A packet capture library is required for capturing Pcap data. Install the Npcap packet capture library before the probe starts. While installing the library, WinPcap API-compatible Mode and Support Loopback Traffic options should be selected.
Run
streamMonitor.exein your command prompt with administrator rights.Allow
streamMonitor.exeto communicate in public and private networks (set two checkboxes in the Windows Firewall).
Linux
To run the probe with root privileges, use the
sudo ./streamMonitorcommand.
More information can be found in the User Guide under Probe installation.
3. Run analysis tasks
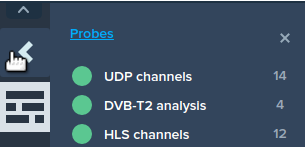
After running the probe, the service page should update automatically. Open the sidebar containing the name of your probe and click it.

To start an analysis task, click the Add Task button and select a task type in dropdown menu: IPTV, OTT, SRT or RTMP. The Add Task window opens.
Fill in the fields listed below and click the Run button in the resulting window. You can run several streams simultaneously. To learn about other parameters, use the pop-up hints or go to the User Guide.
URI - URI of the streams to be analyzed (to see the list of supported prefixes, hover the question mark icon near the input field).
Name - name of the analyzed stream. When specifying a task name, do not use the following characters:
"<>.Network interface IP - NIC IP address used by the probe to receive the stream. Leave it blank if you want the probe to work according to the routing table.
Click the LiveView icon to check the run visually

For detailed information about the stream click its name.
Note